Synadia Cloud
Connection Graph
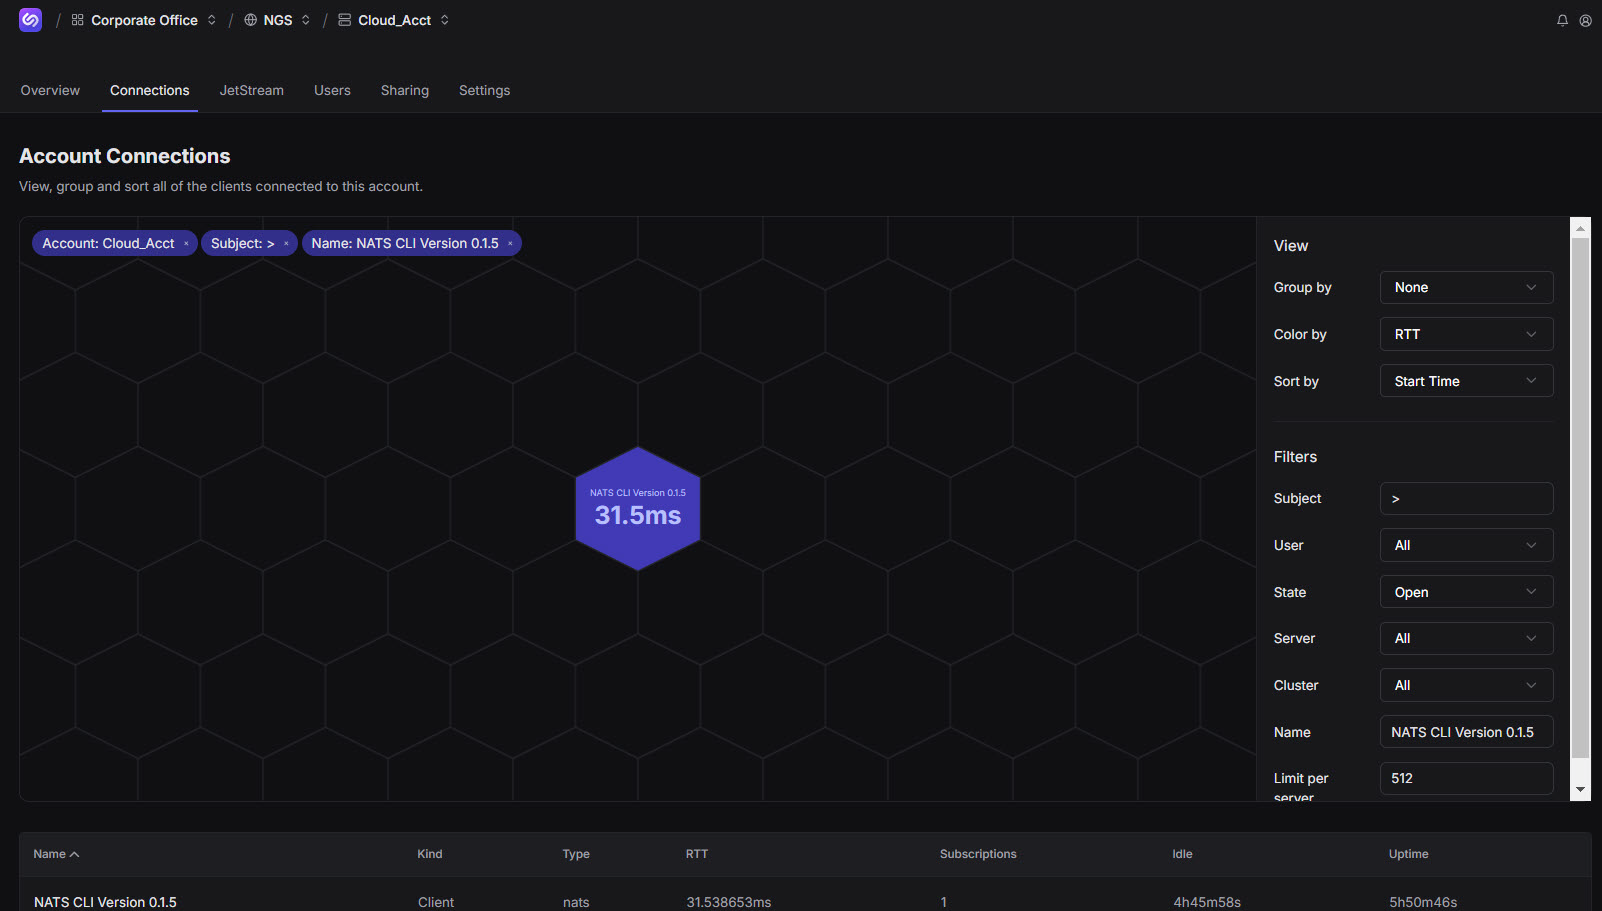
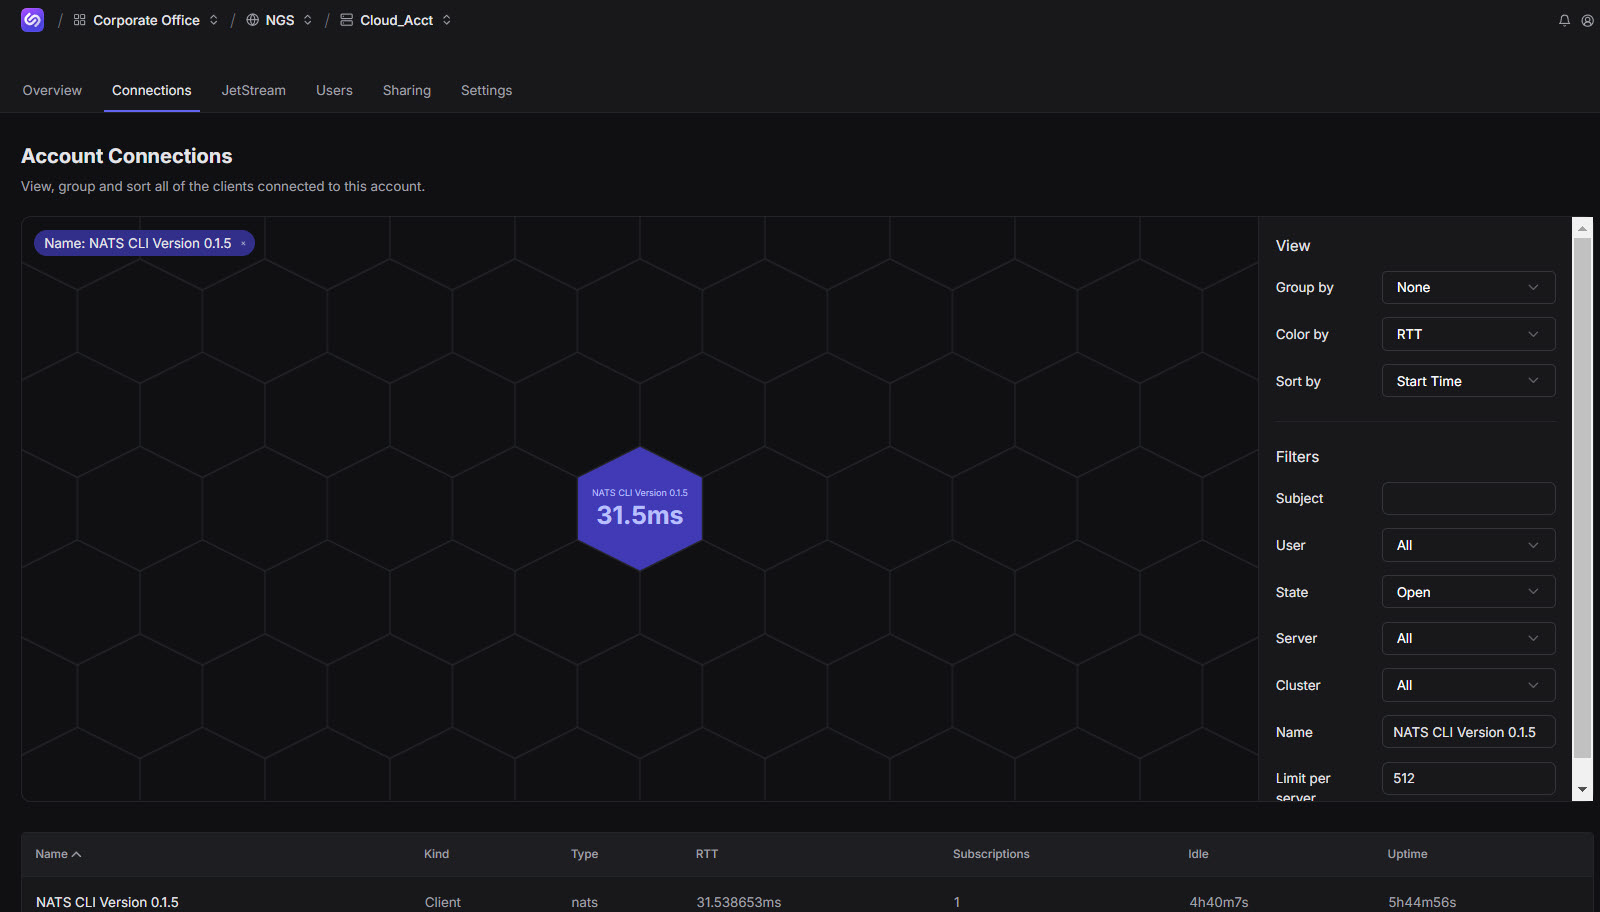
The Connection Graph displays client connections to the NATS server. You can view, group, and sort connections. Each graph section (or object) represents a connection. The Connection Graph and its range of search parameters allow you to gain insight about your NATS server connections. The Connection Graph not only displays what is connected but also allows you to determine if any issues exist that you may need to troubleshoot (based on details revealed when you select each connection). You can view live connections along with older and/or closed connections.
You can use the mouse/scrollbar or trackpad/touchpad to zoom in/zoom out of the Connection Graph. You can also select specific sections of the Connection Graph, enabling you to grab or drag the entire object to reposition it within the window.
Features
There are two primary categories of connection search parameters: View and Filters
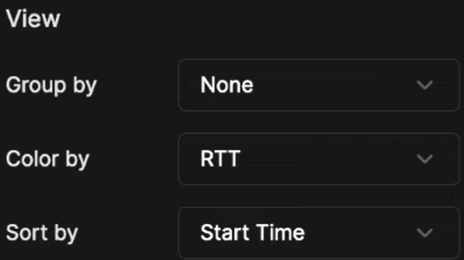
View
This section contains Group by (None/Default), Color by (RTT/Default), and Sort by (Start Time/Default).
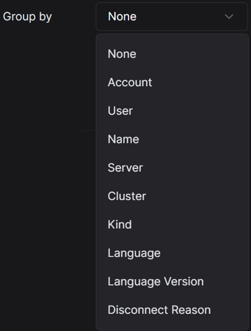
Group by
You can Group by several parameters such as None (default), Account, User, Name, and Server.
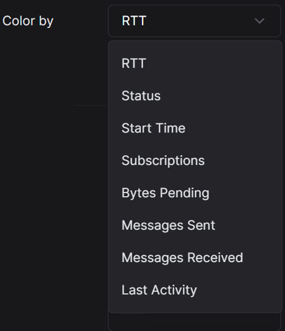
Color by
You can Color by several parameters such as Status, Start Time, Subscriptions, and Bytes Pending. Round Trip Time (RTT) represents the response time to and from the NATS server. The lighter the color in the Connection Graph, the more efficient the RTT.
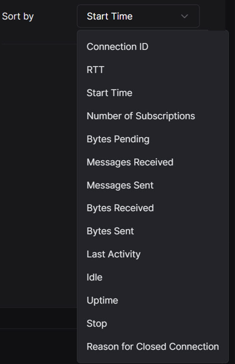
Sort by
You can Sort by several parameters such as Start Time (default), Number of Subscriptions, Messages Sent, Bytes Received, Last Activity, and Reason for Closed Connection. Color by and Sort by contain many of the same parameters. Sorting allows you to organize results to view Messages Sent, for example, to gain a sense of how your system is working.
As with all connection searches, you can choose parameters from View and combine this selection with parameters from Filters. Some parameters append to the Account Connections window.
Filters
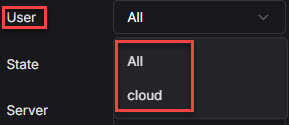
Filters further narrow your result output and include Subject, User, State, Server, Cluster, and Name. You can filter Users by parameters such as All (default) or by specific users. In this example, we previously created a user: cloud
You can filter by Cluster using several parameters such as All (default) and any other available clusters you have used, such as ngsprod-aws-uswest2 or ngsprod-aws-useast2.
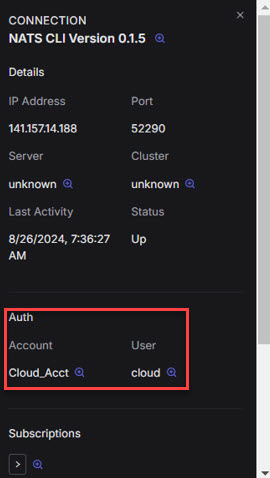
To view additional Account Connection details:
Click a connection.
The right panel displays connection details. For example, Auth reveals the Account Name and User information.
Click the magnifying glass (icon) next to the Subscription field to further filter.
A table below the Connection Graph displays additional information.