

Synadia Platform
Alert Rules
GOAL: The goal of Control Plane Alert Rules is to provide observability and enables monitoring of connected NATS Systems through a set of default Alert Rules that ships with Control Plane and a GUI that allow for creating custom Alert Rules.
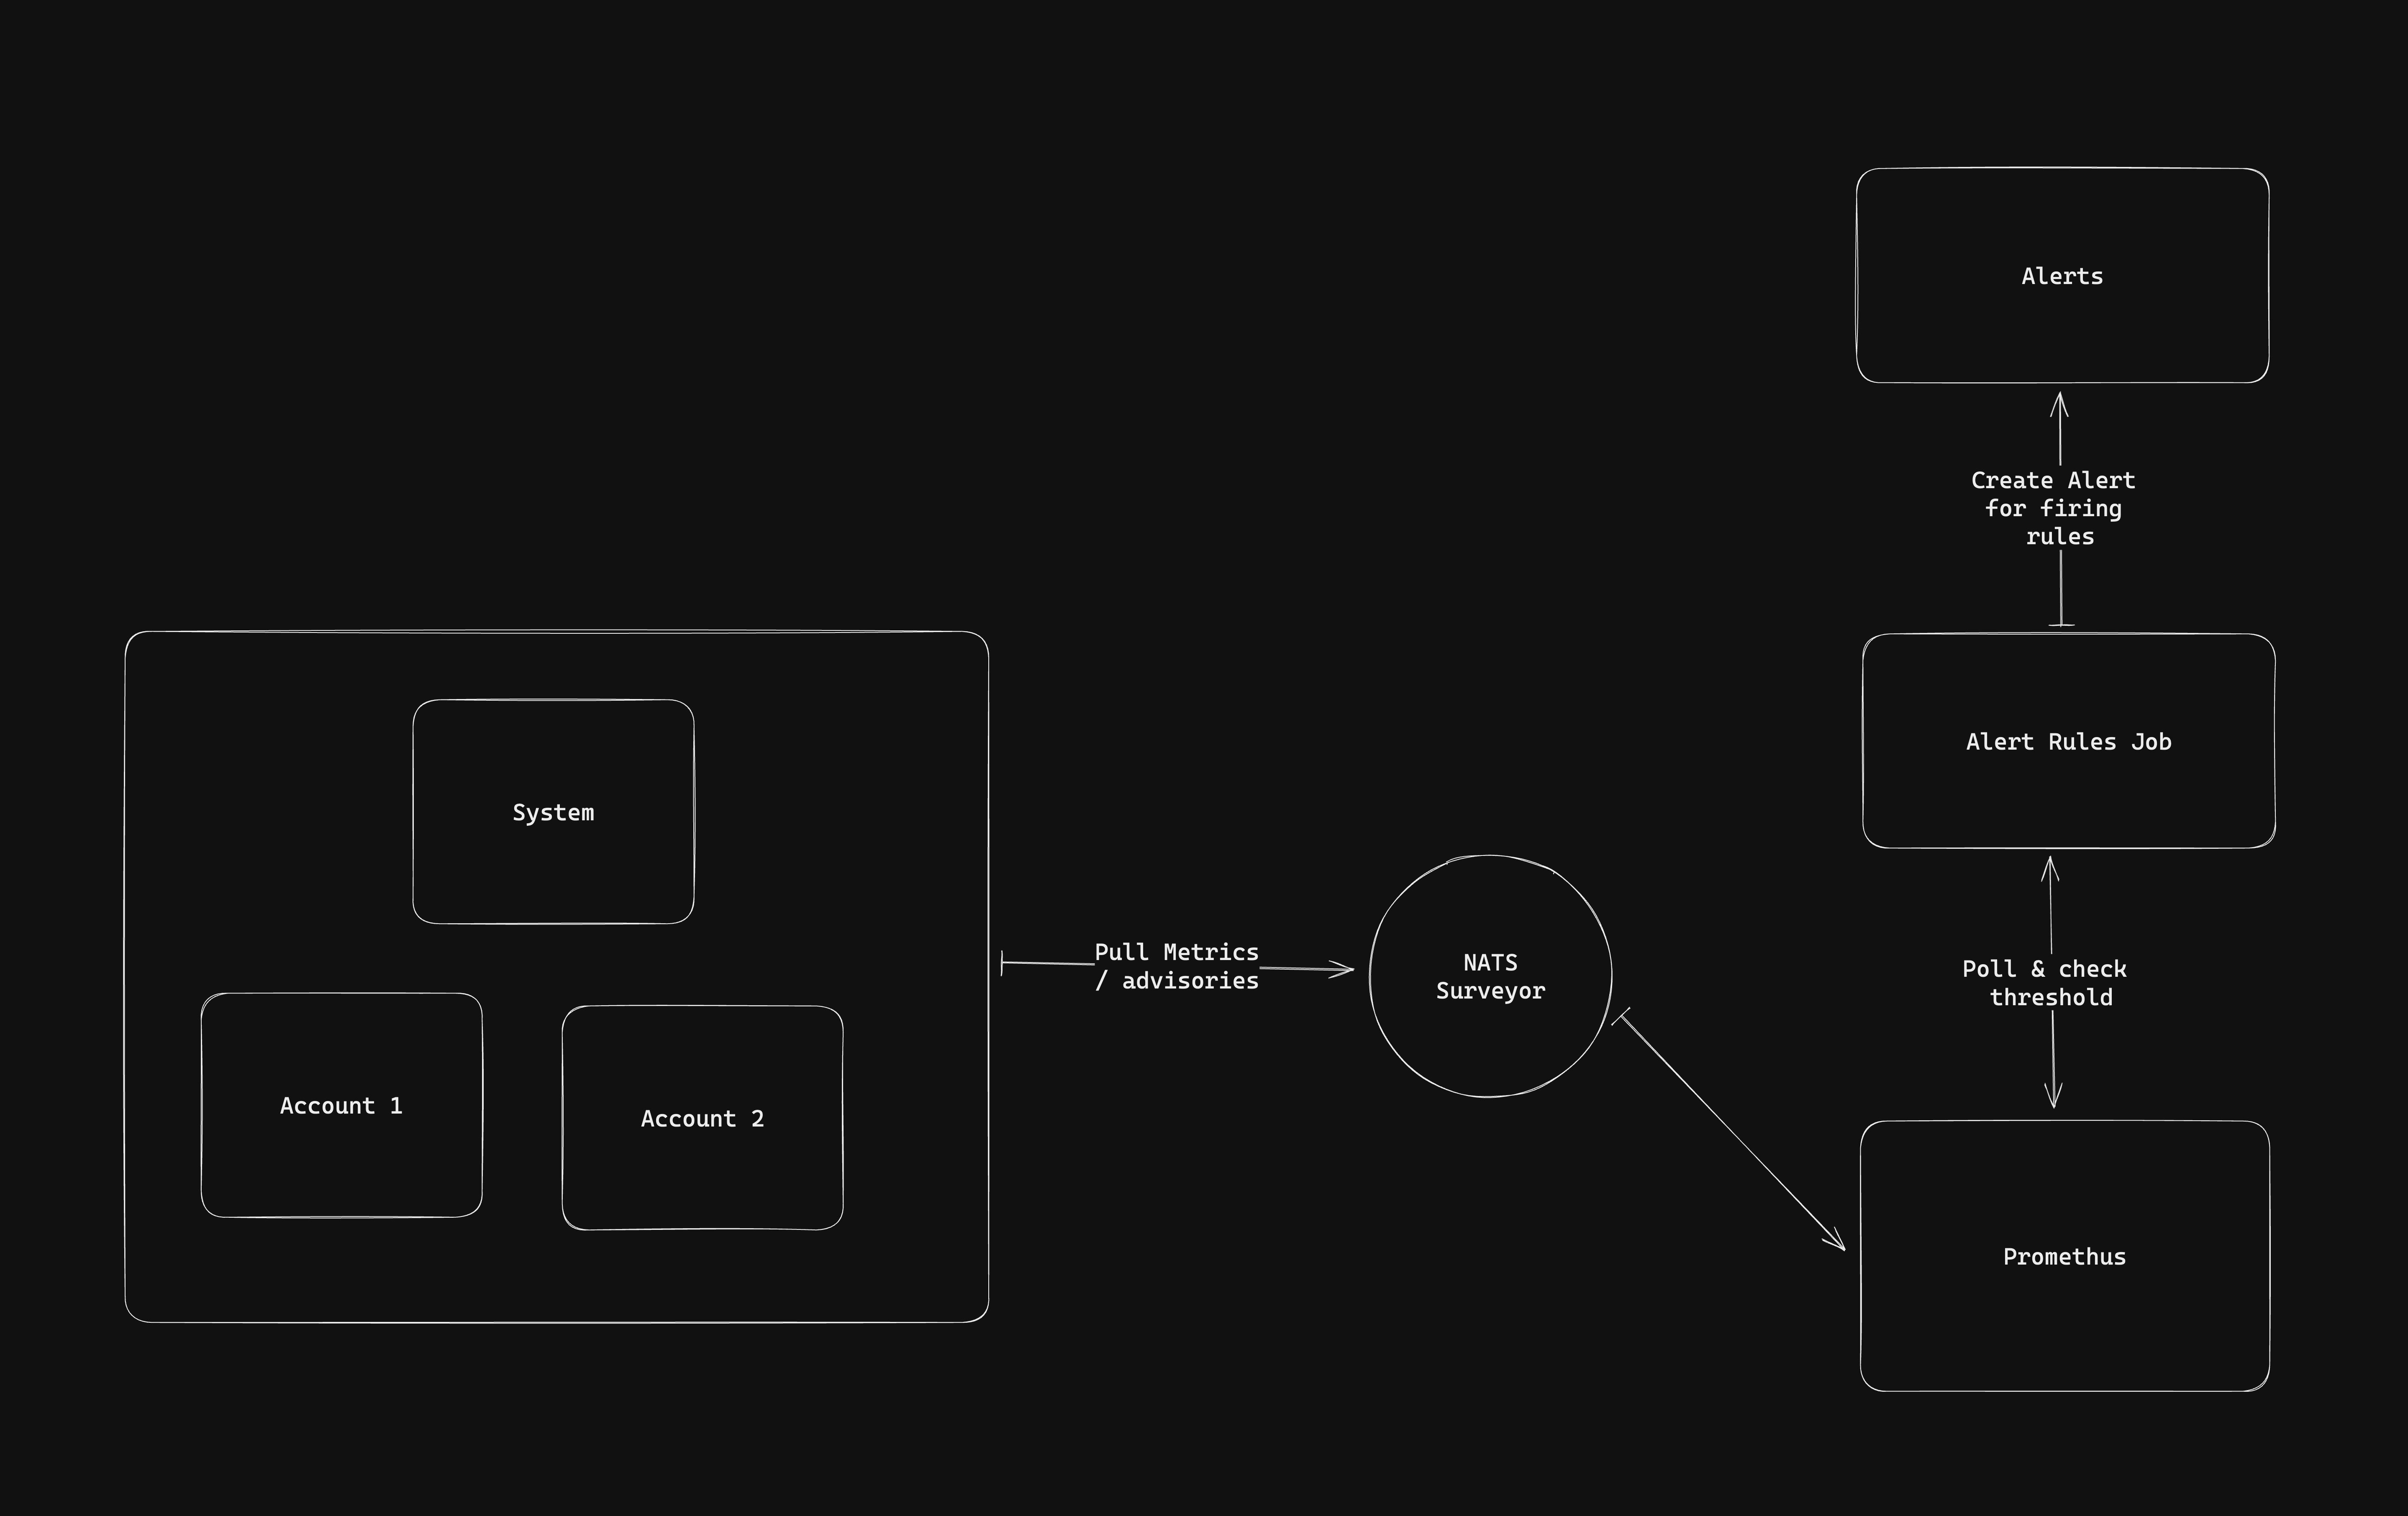
Architecture:
Control Plane uses a cron-style job to run queries to Prometheus and compare the threshold configured for different Alert Rules with relevant metrics reading from Prometheus. NATS Surveyor is used to poll metrics & advisories values from NATS setup.
Terminology:
- Default Alert Rules: A predefined set of Alert Rules that ships with Control Plane and covers critical key metrics to NATS operations. Default Alert Rules are editable from a config file.
Default Alert Rules runs against all new and existing Systems or Accounts. They can also be disabled for a specific System or Account.
Custom Alert Rules: Custom Alert Rules run against a single System or Account.
Alerts: Alert is the product of a firing Alert Rule, Alert Rules job creates and closes Alerts by comparing the Alert Rule threshold to the metric reading from Prometheus.
Default Alert Rules
View default System Alert Rules
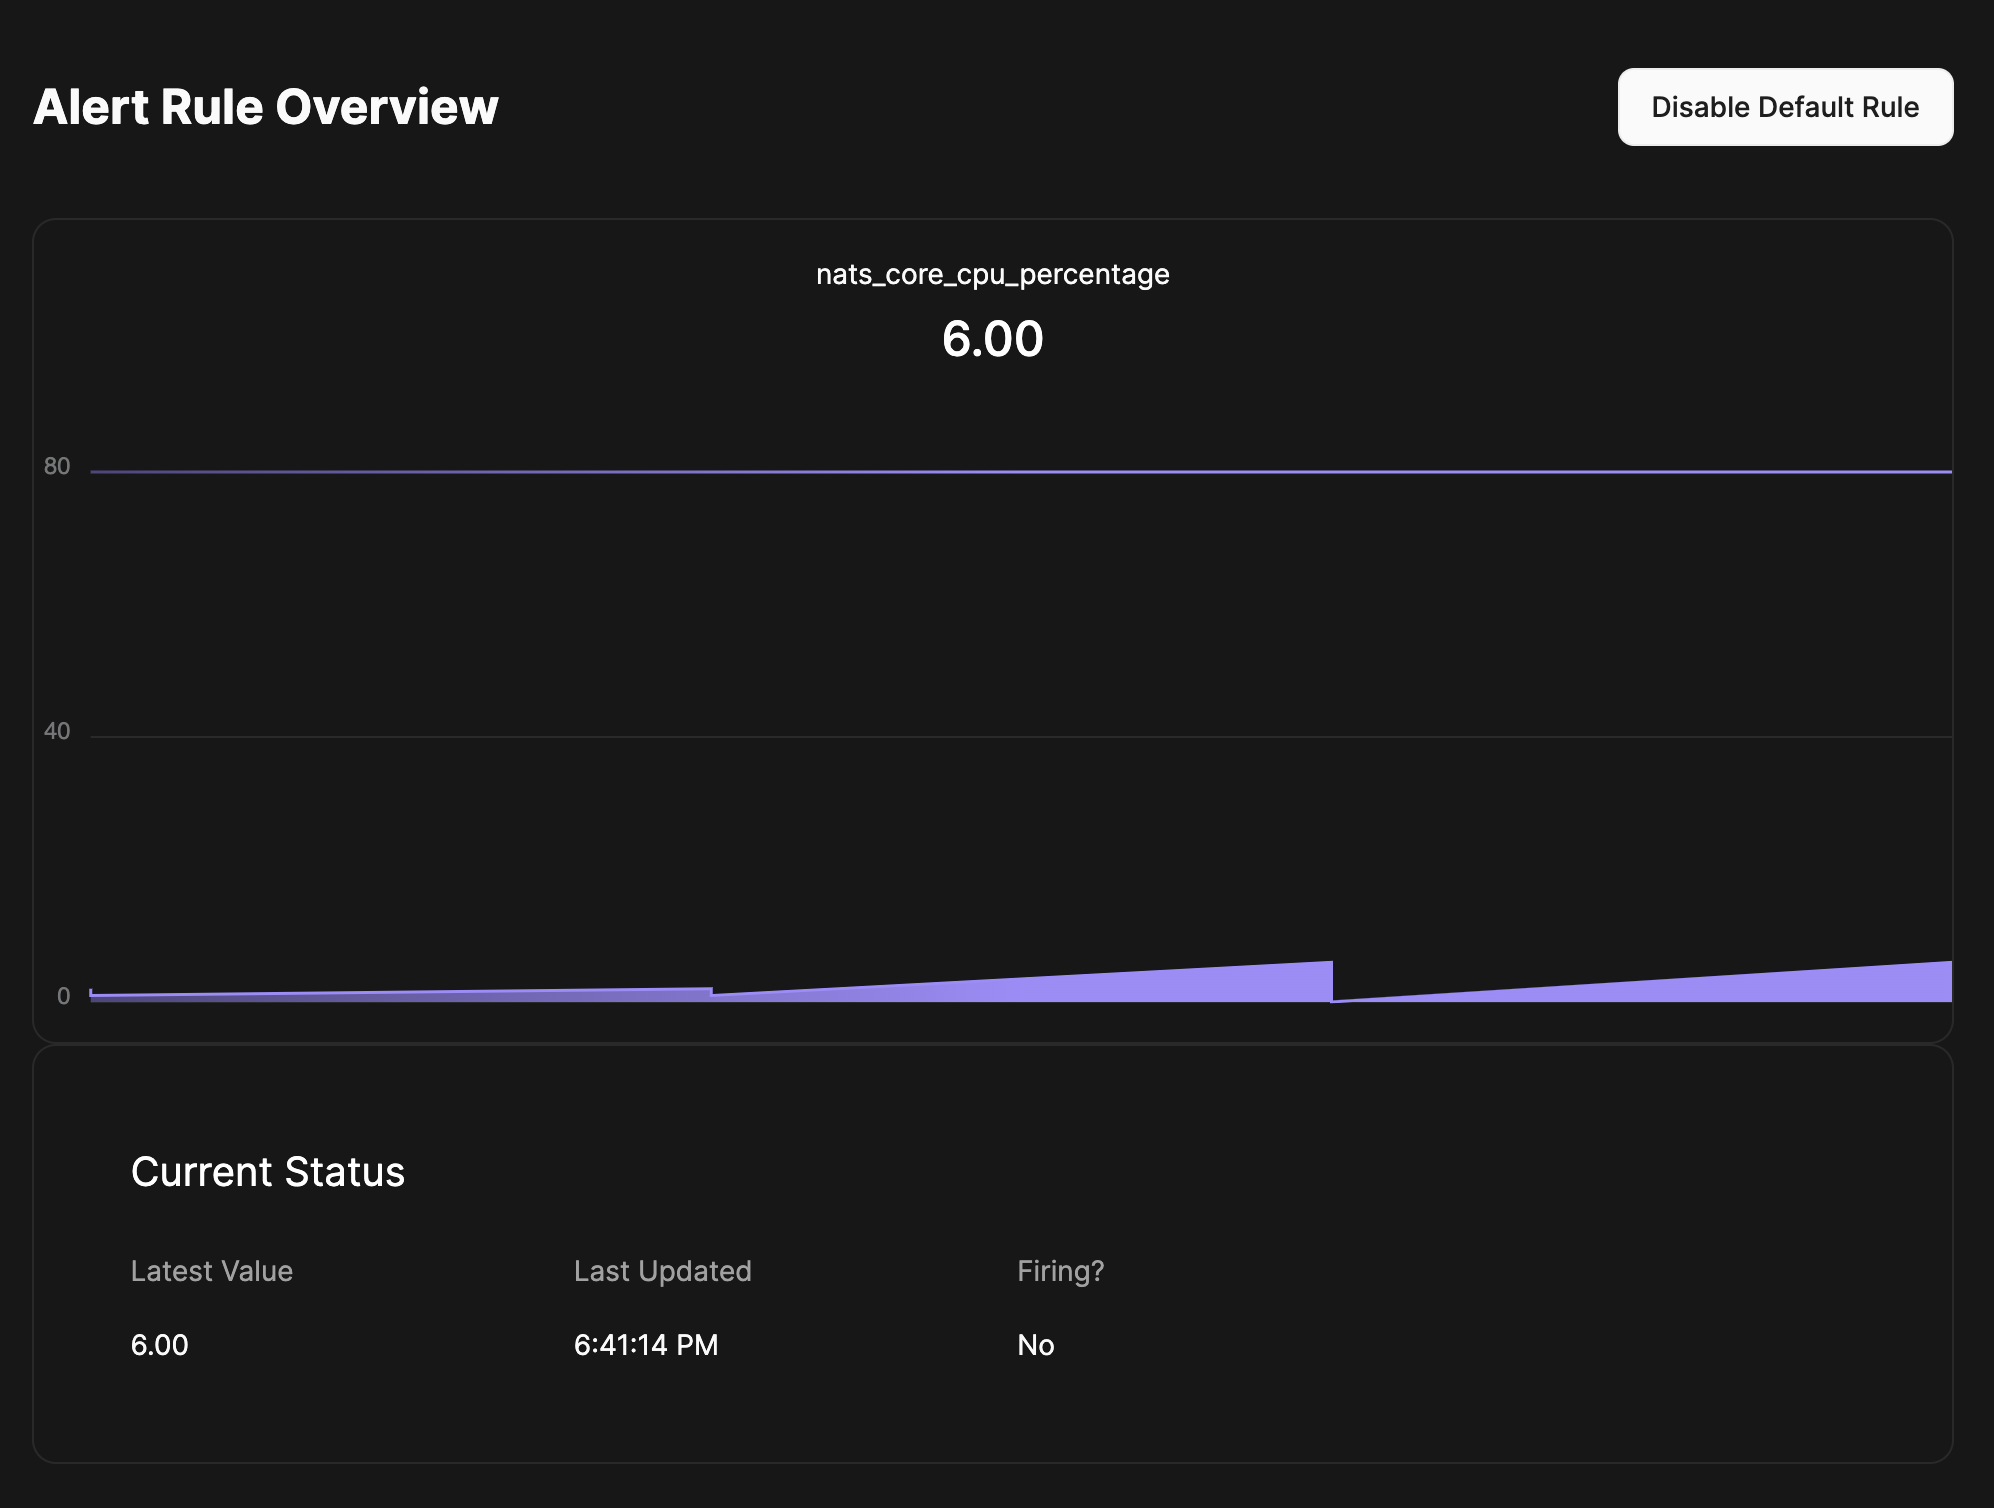
Default Alert Rule overview page allows for viewing Alert Rules definition (name, metric, threshold) as well as a live reading of metric value.
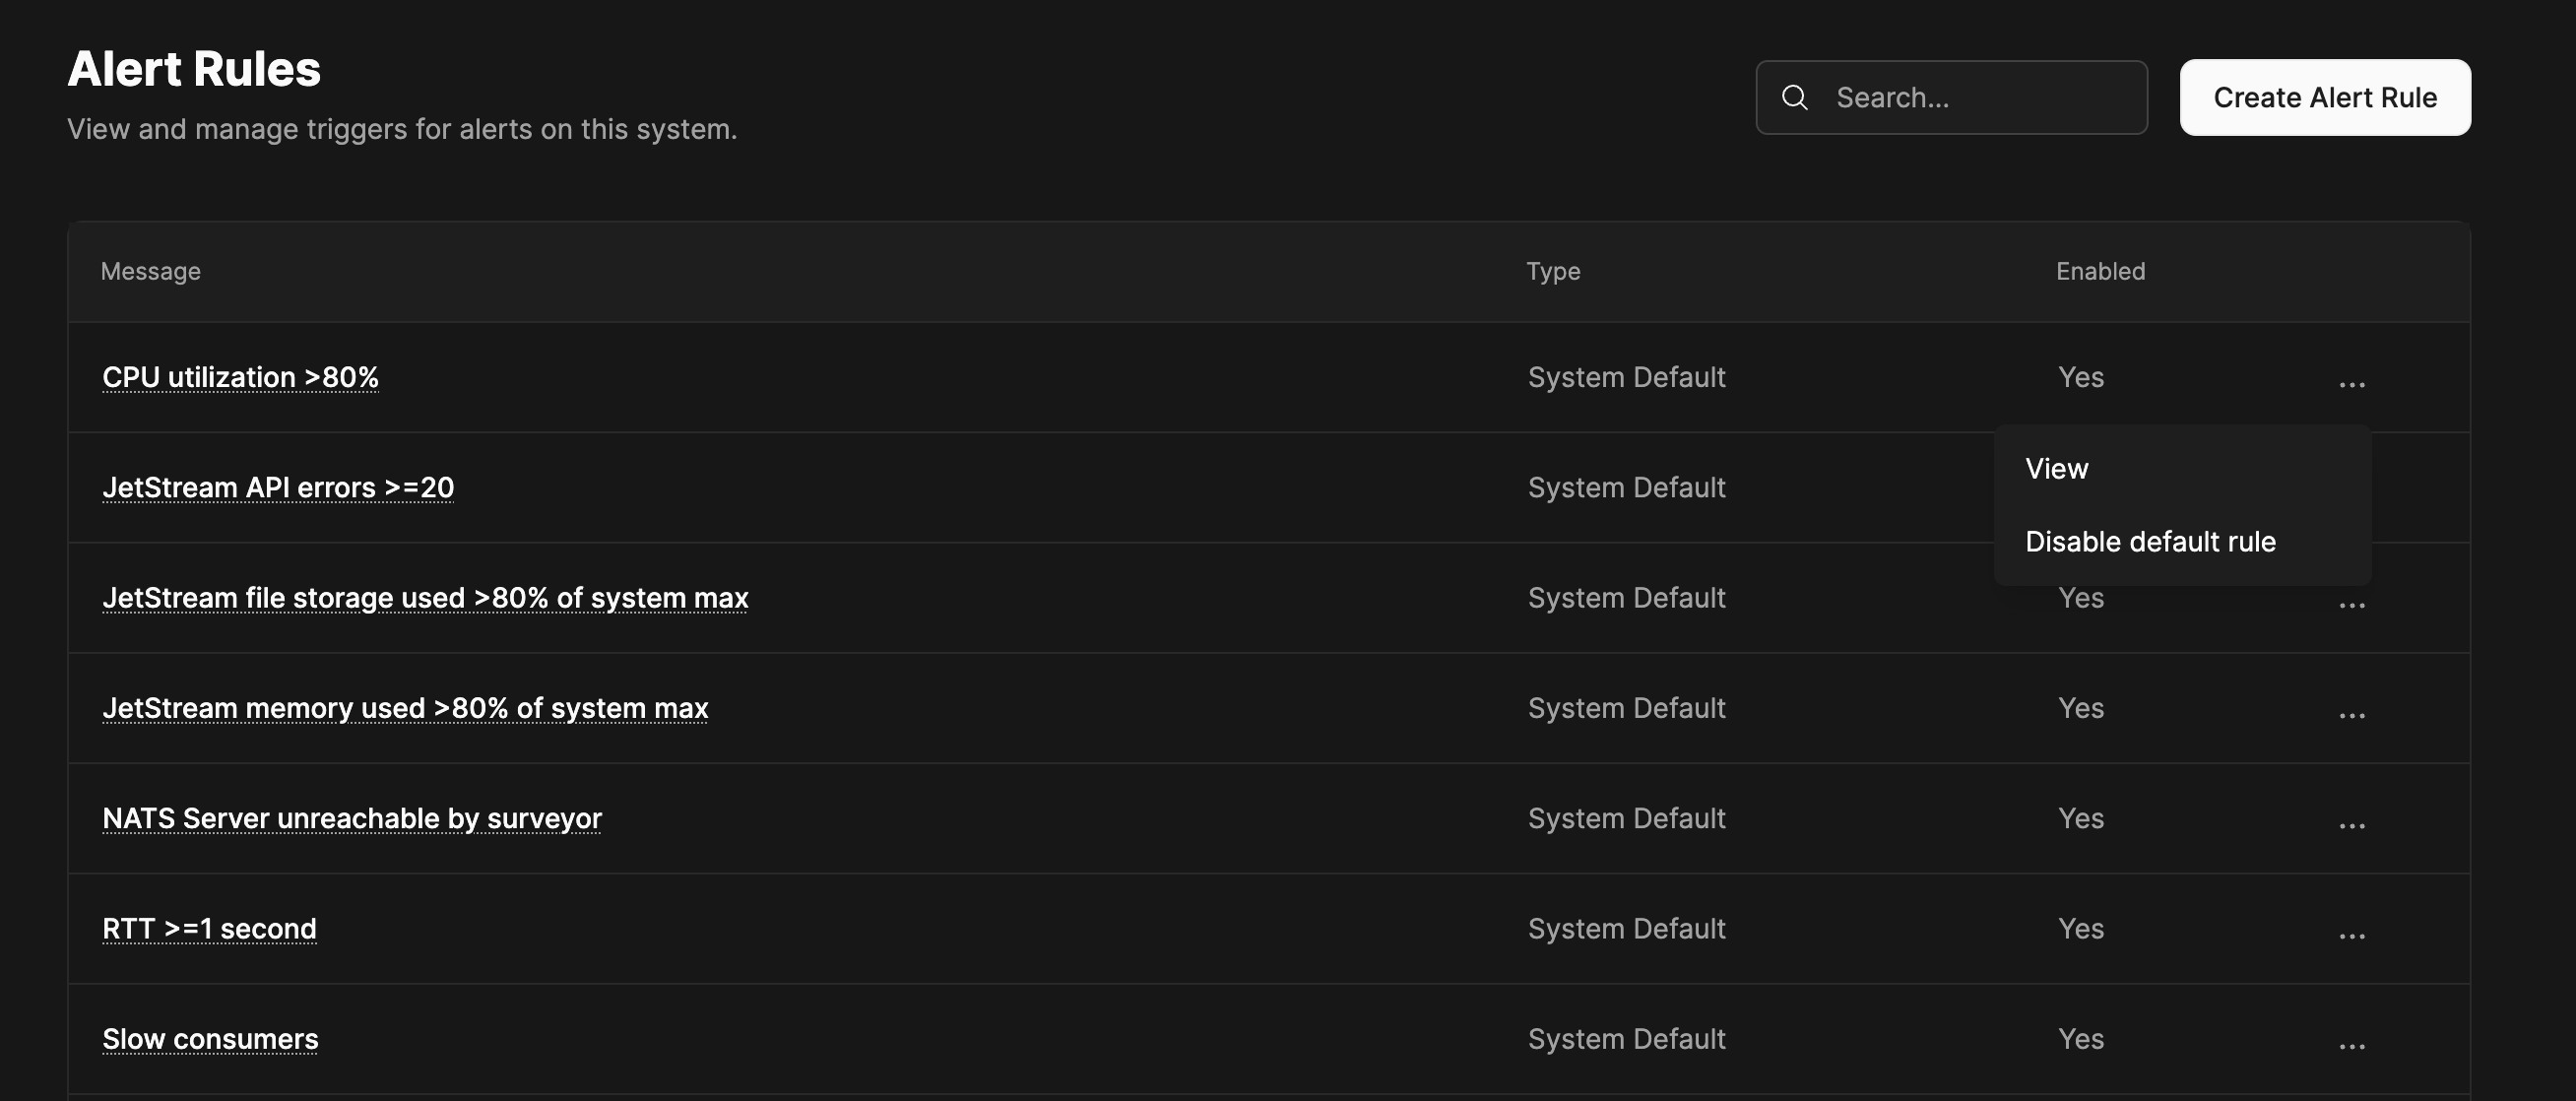
- Once in a System, click on the Alert Rules tab.
- Click on the Message of any Alert Rule from the list.
- View the Alert Rule details to see the current status, whether if the rule is firing and current metric reading.
Access to viewing Alert Rules inherits the permission from the linked resource (System, Account, Stream or Consumer), a user can view only the Alert Rules for the resources which they have access to.
View default Account Alert Rules
- Once in an Account, click on the Alert Rules tab.
- Click on the Message of any Alert Rule from the list.
- View the Alert Rule details to see the current status, whether if the rule is firing and current metric reading.
Disabling default Alert Rules
- Once in a System or an Account, click on the Alert Rules tab.
- For the target Alert Rule, click the Actions ellipsis.
- Click Disable default rule.
- Read the confirmation message and confirm disabling the default rule.
Disabling default Alert Rules applies to the open System / Account only, the rule will still run against other Systems / Accounts
Override default Alert Rules
In order to override default Alert Rules for a specific System or Account:
- disable the default Alert Rule as per the previous section
- create a custom Alert Rule for the same metric
Custom Alert Rules
Custom Alert Rules are System or Account level configuration, creating or updating Alert Rules under a specific System or Account means this rule applies to this System / Account only
Custom Alert Rules metrics and thresholds:
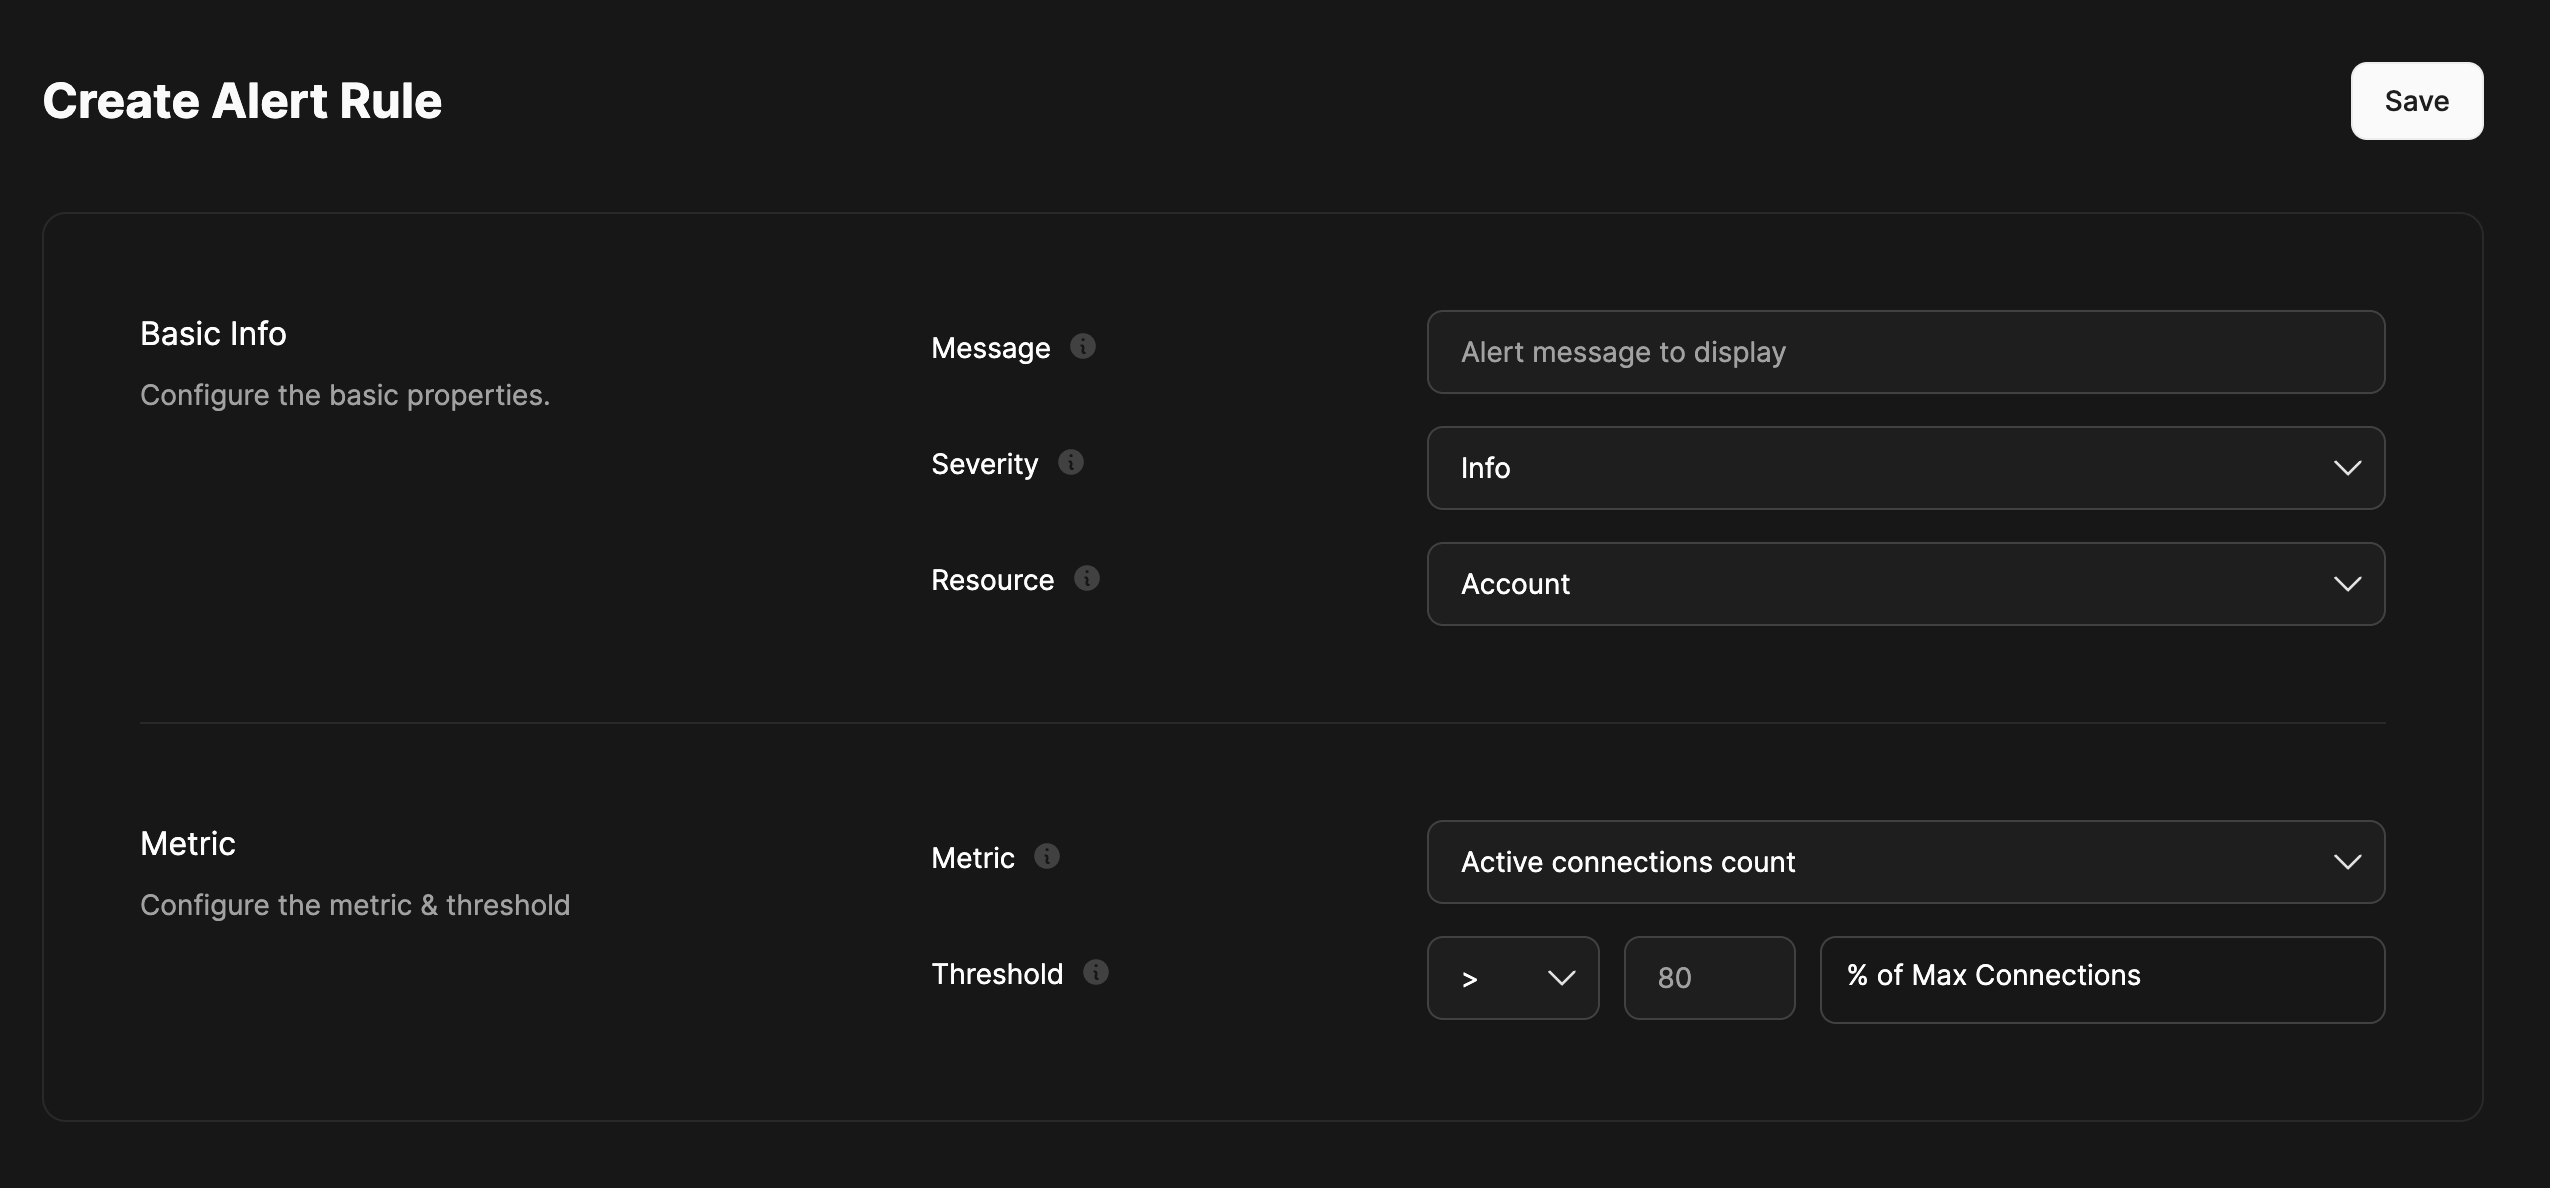
Creating an Alert Rule involves filling multiple fields like the rule message (which will show in the alert in case of firing), severity, the resource to be monitored (Account, stream or consumer), the Metric to watch, for ex: active connection count, and Threshold which is a relative value to the metric reading, depend on the selected metric, Control Plane will show one of 2 options for thresholds:
- Relative threshold, will be shown if the select metric can be mapped to one of the resource config properties, for ex if the selected metric is
Active connection count, the UI will ask to enter a percent of the Account'sMax connections - Fixed value: the UI will ask for a fixed value for the threshold if the selected metric can't be directly mapped directly to a resource limit.
Alerts
Control Plane creates an Alert every time an active Alert Rule threshold has been met.
There is a badge that shows the count of open Alerts on the top right of the screen left to the profile icon, clicking on this badge will show a menu with all open Alerts, each Alert is clickable to the Alert details page. 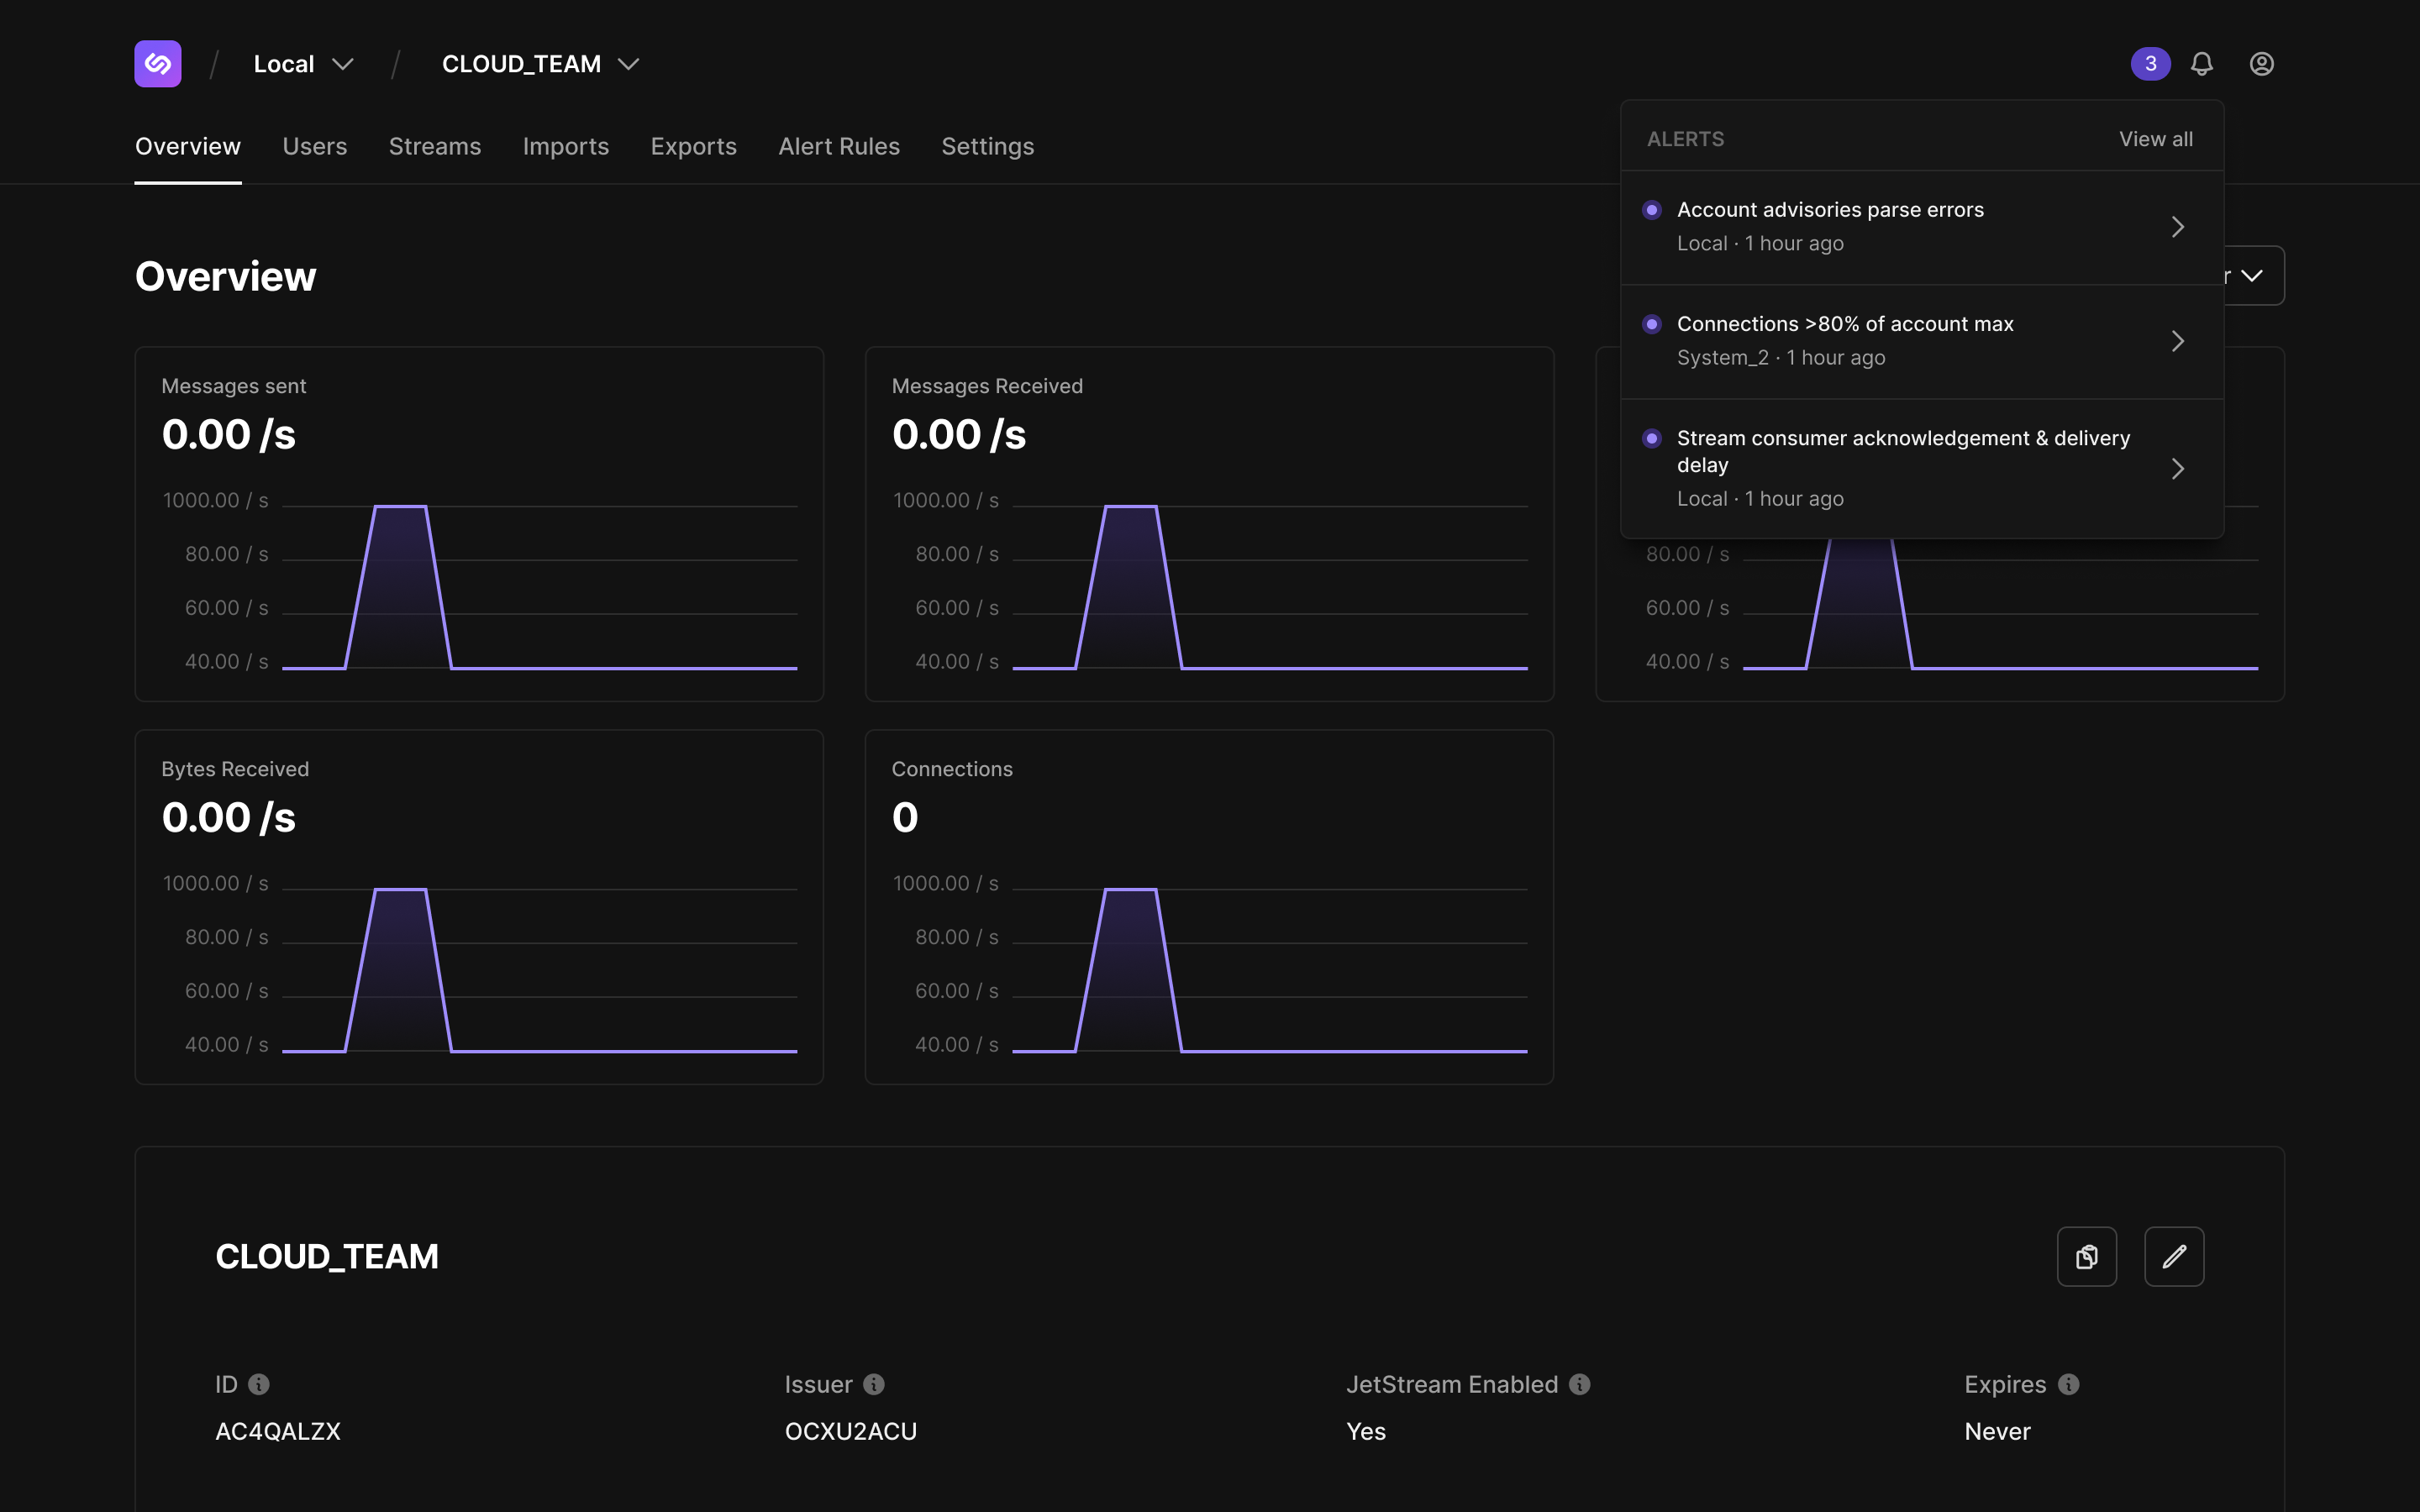
View & Acknowledge Alerts
- Navigate to Alerts page.
- Select the target Alert from the Open Alerts or the Closed Alerts lists.
- View the Alert details like source Alert Rule, metric value caused the Alert to fire and first seen date/time.
- To acknowledge an alert, please click Acknowledge Alert, this will remove the alert from the counter badge and menu on the top right and will silence the Alert for everyone, but the Alert still remains open until it falls back under the threshold. If the Alert fires again, a new Alert is generated.
Control Plane periodically checks and closes any open Alerts if the source Alert Rule threshold is not being met anymore and it reopens closed Alerts if thresholds are met again.
External Alert Sinks
Control Plane supports configuring external alert sinks.
Slack
To send alerts for a system to Slack, configure a Slack receiver in System Settings > Visibility > Slack:
Channel: Can be a channel name or channel ID. To find a Slack channel ID, right-click the channel in Slack, select View channel details, and copy the Channel ID at the bottom.
Token: Supports the following token types: Bot token (starts with
xoxb-), User token (starts withxoxp-), and Legacy bot token.
Tokens require the following Slack scopes:
- chat:write
- chat:write.public
- chat:write.customize
- channels:join
Once configured, alerts will be posted to the specified Slack channel when alert rules fire.