

Synadia Protect
Traces in the UI
This is the UI alternative to the CLI trace workflow. The UI provides a visual trace profile manager and a trace viewer that decodes captured protocol data.
This guide assumes you have a running gateway connected to the UI (see UI setup).
Managing trace profiles
Navigate to Traces in the sidebar. The page lists all active trace profiles:
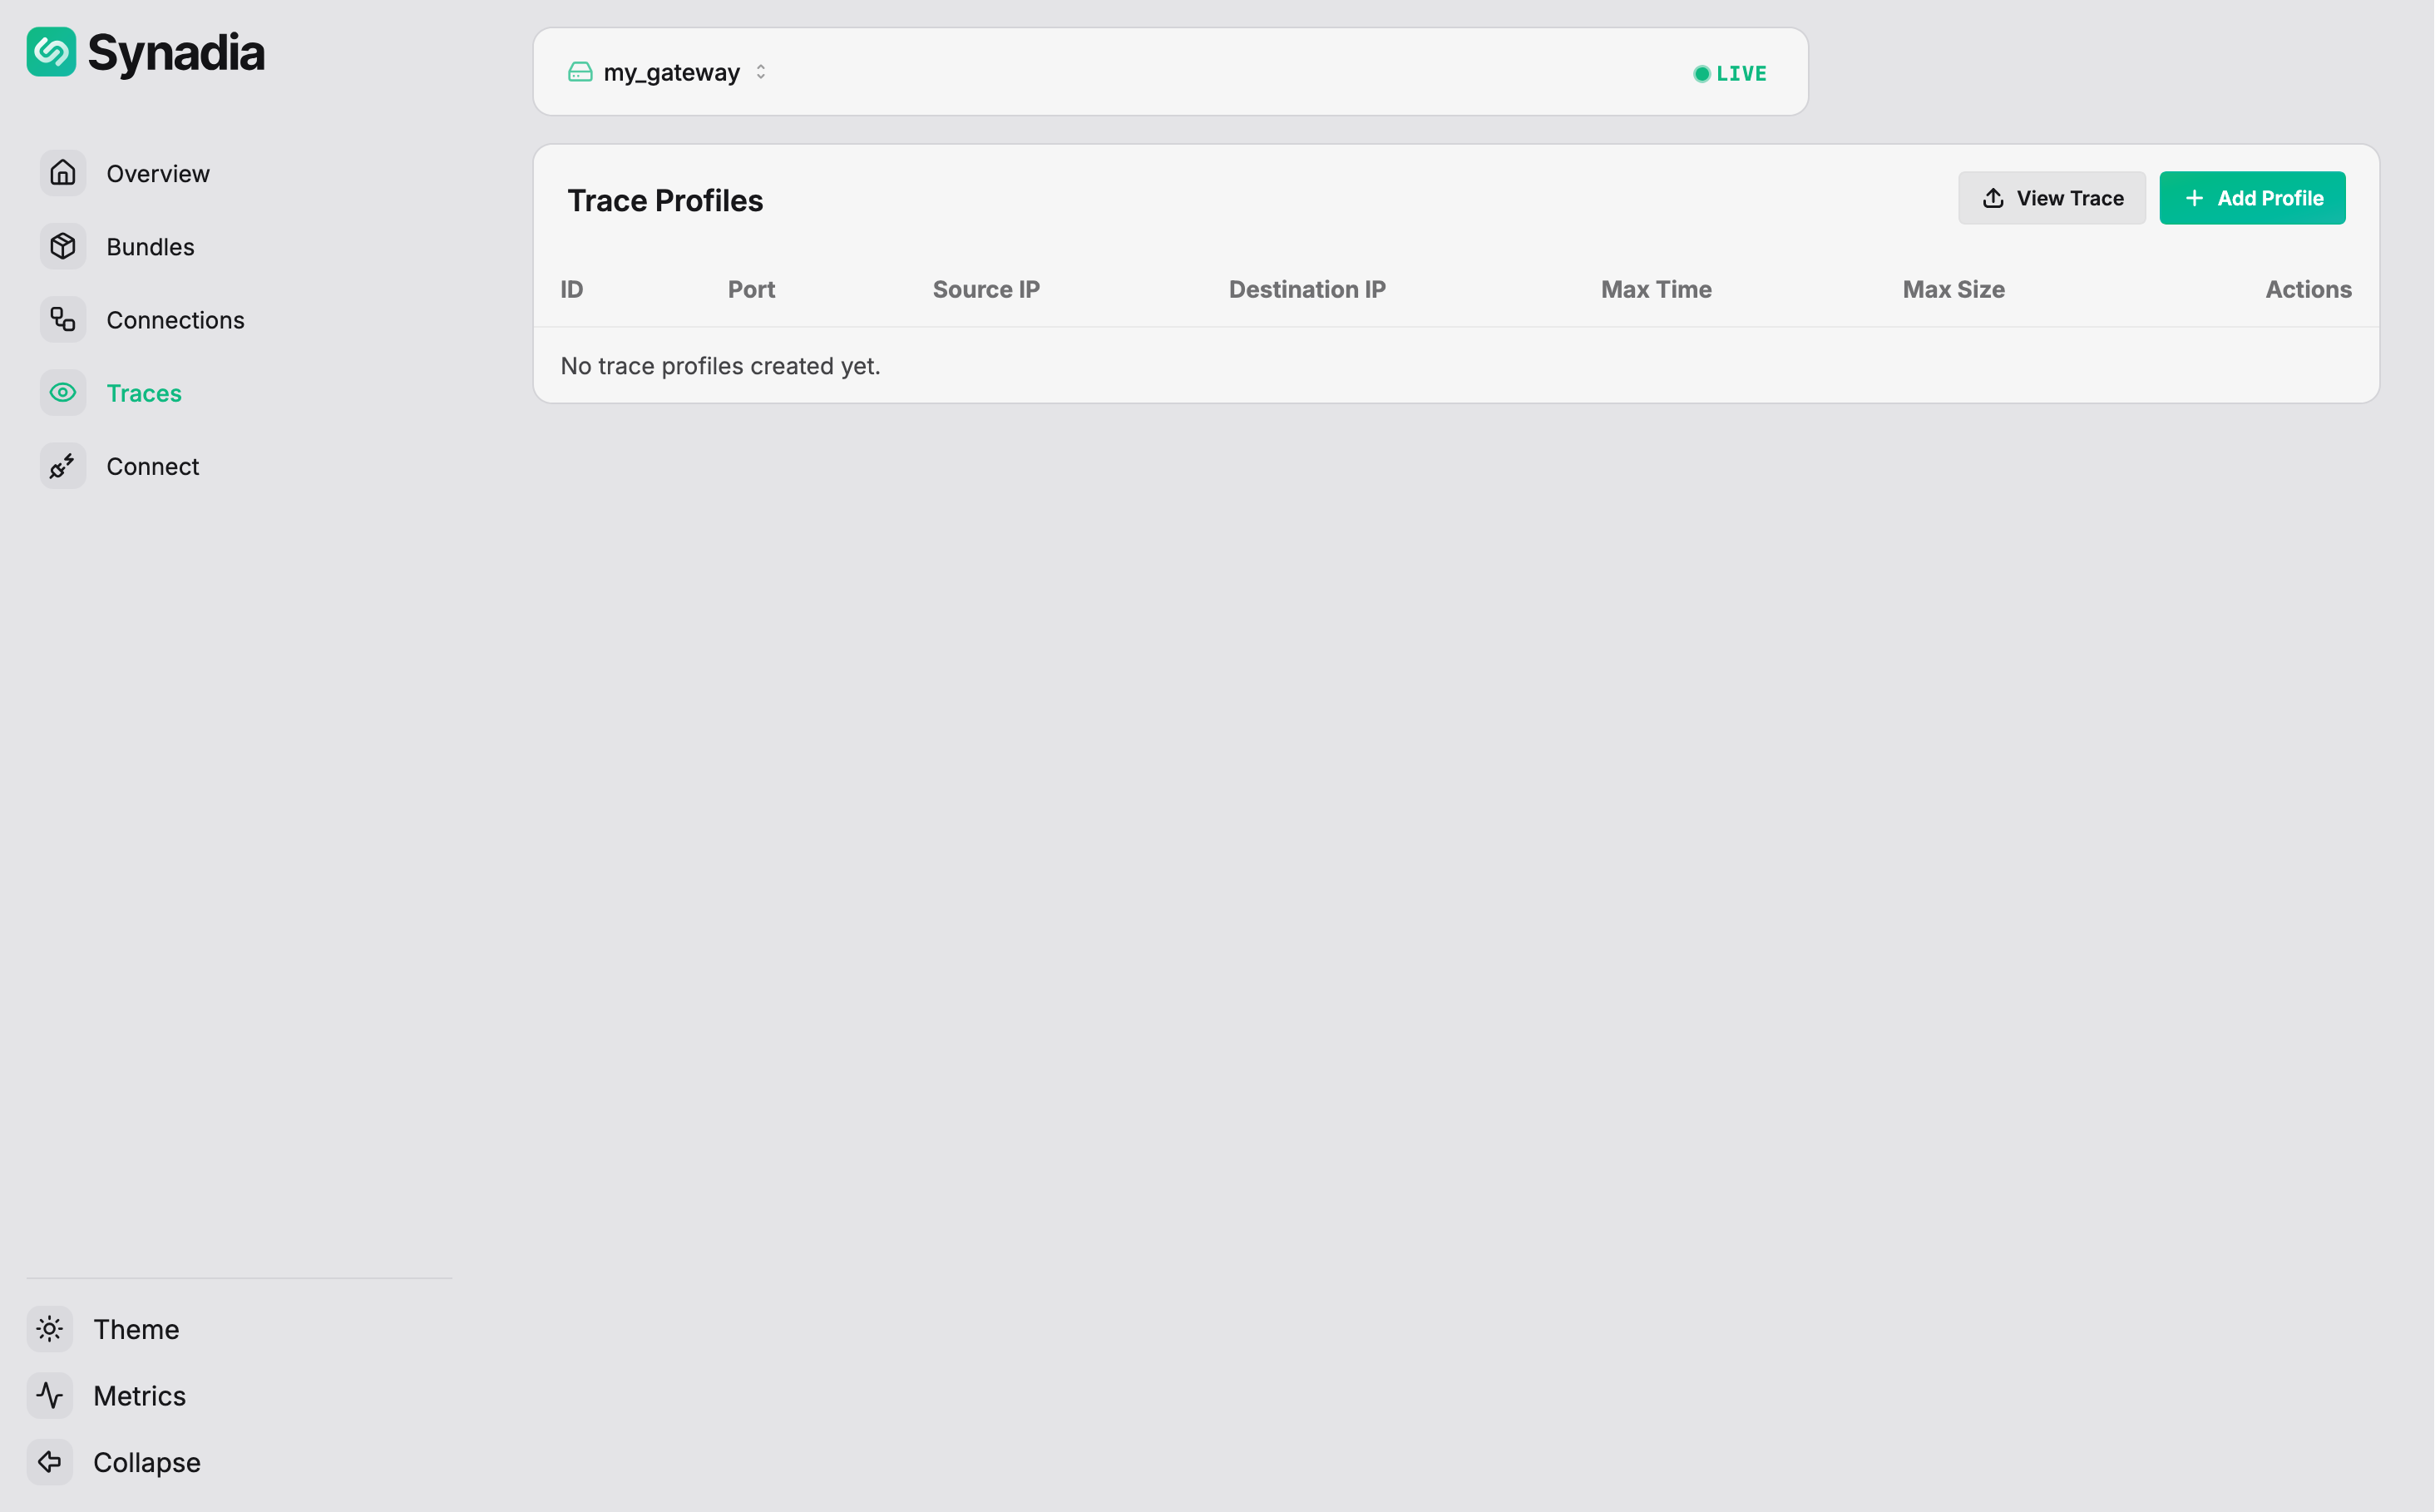
Creating a profile
Click + Add to open the profile form:
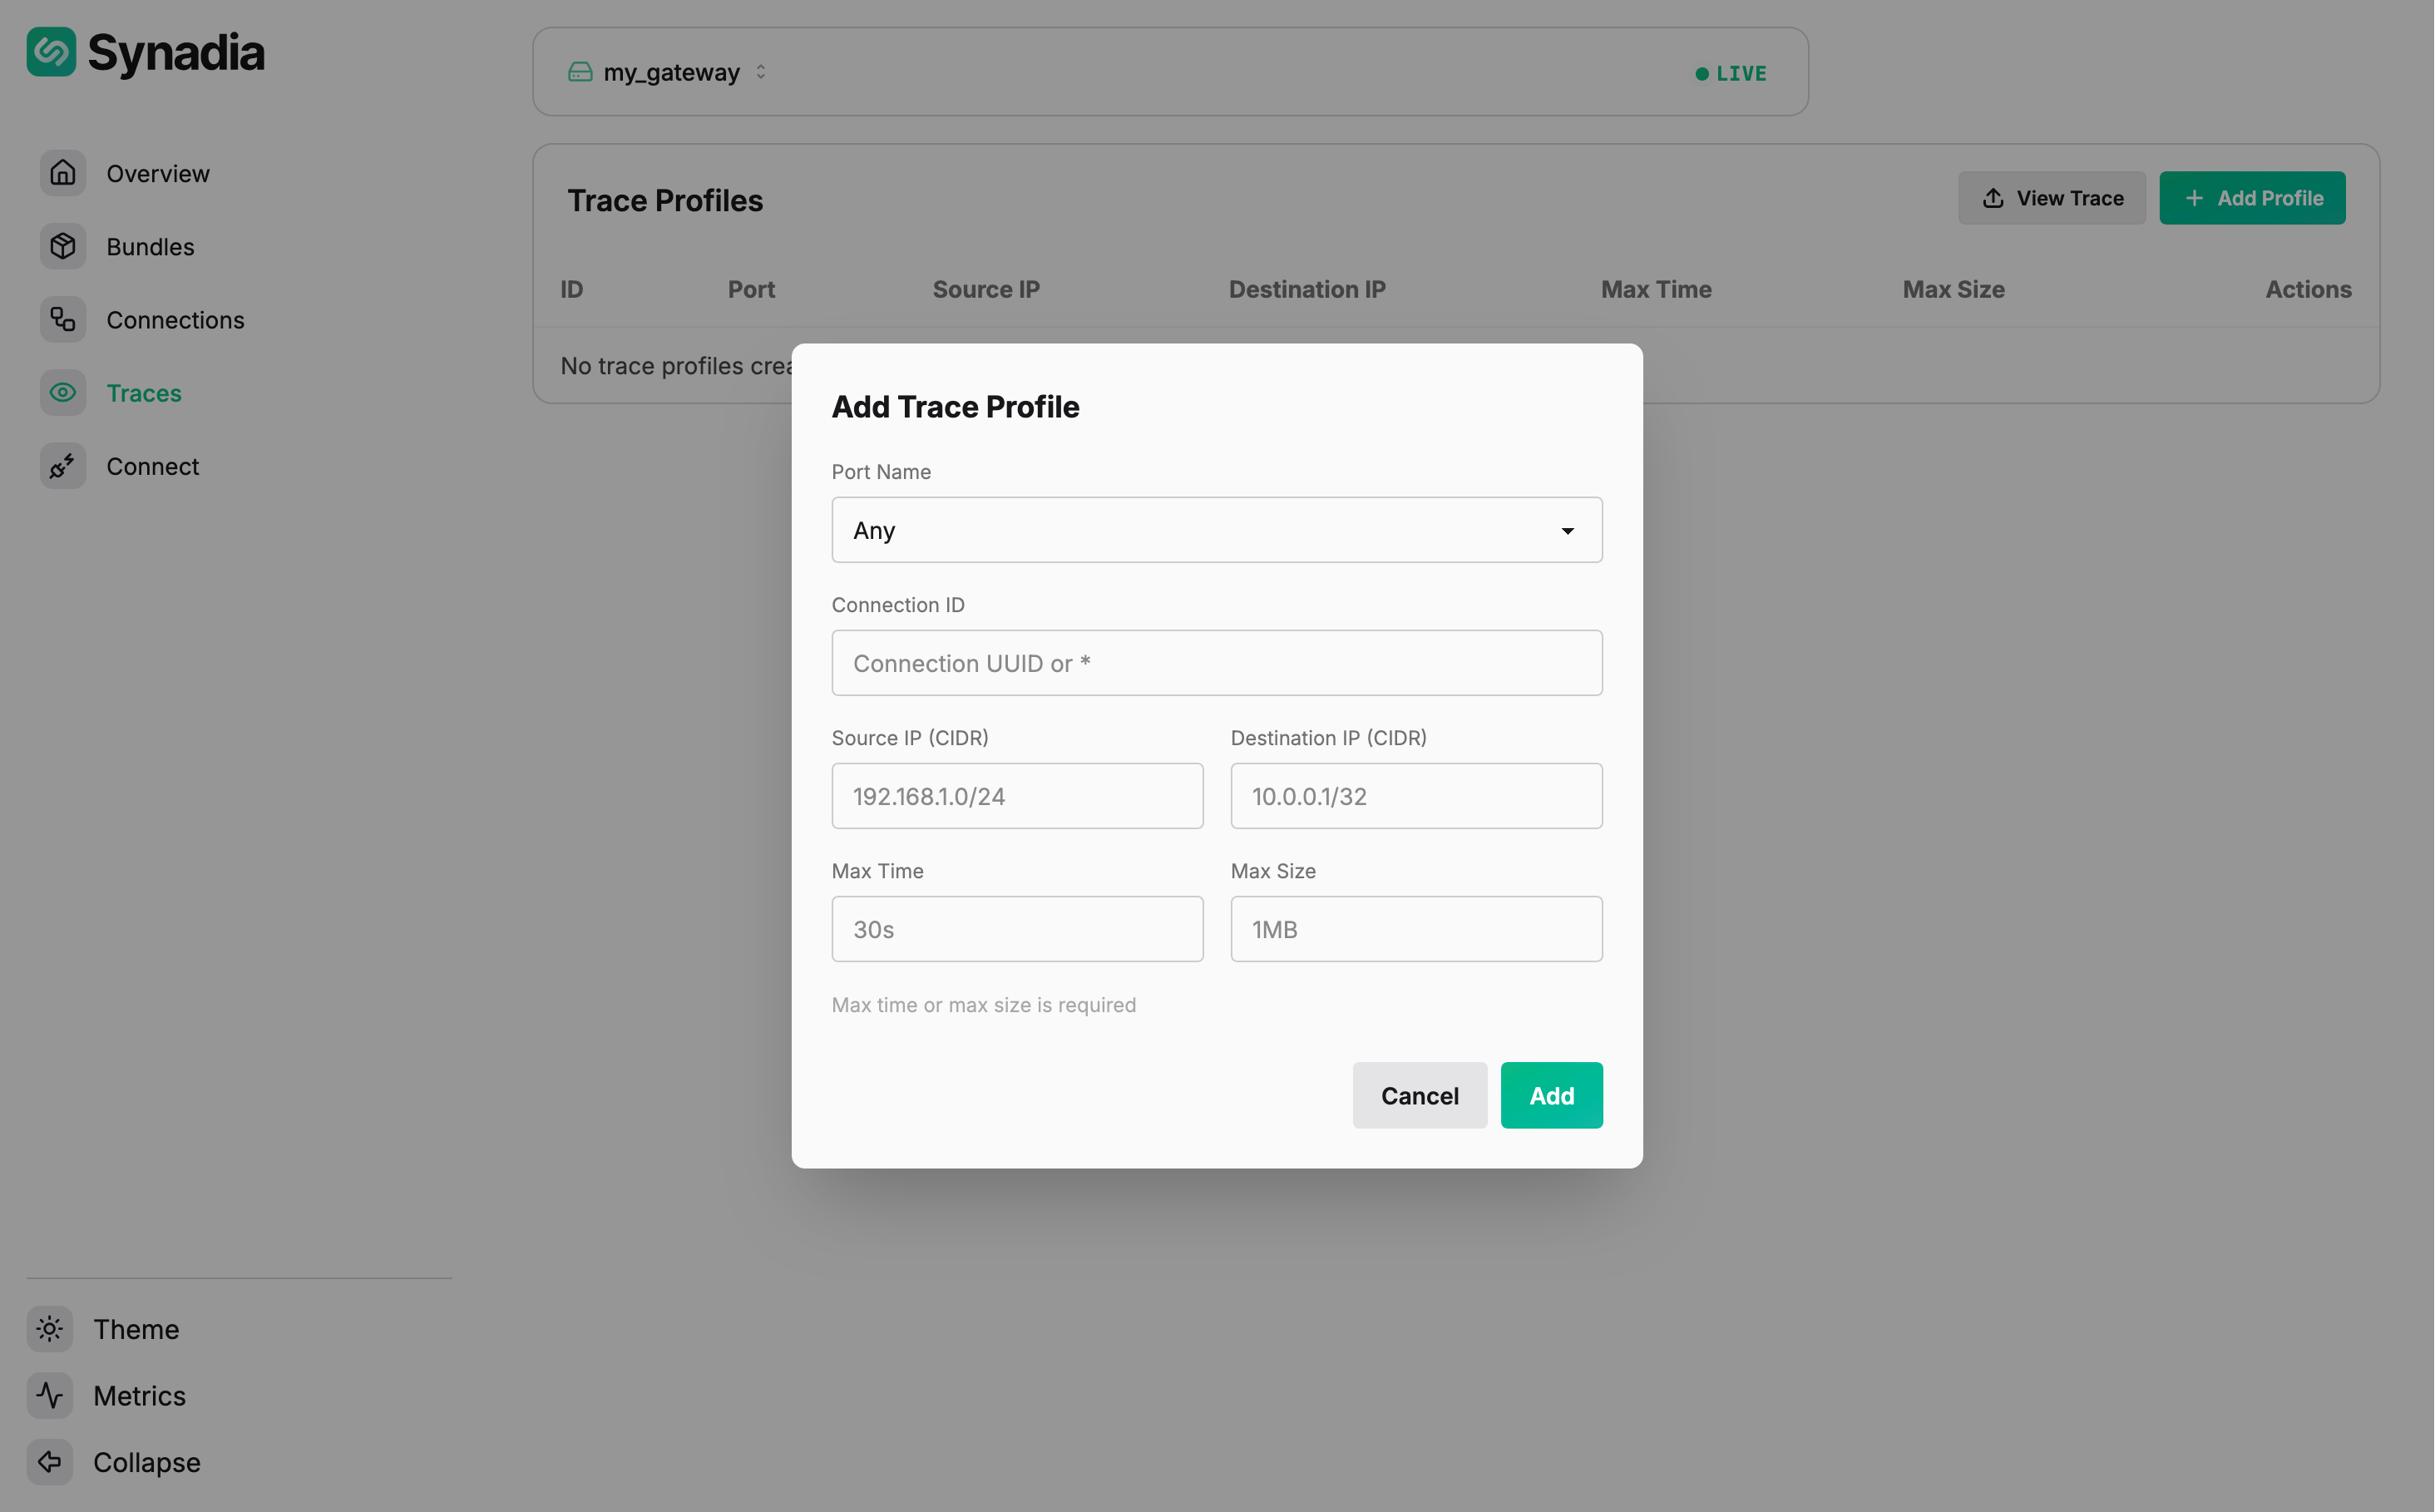
Fill in the matching criteria:
| Field | Description |
|---|---|
Port Name | gateway port to trace (e.g., clients) |
Connection Kind | Any, client, or leaf |
Source IP (CIDR) | client source IP filter |
Destination IP (CIDR) | backend destination IP filter |
Max Time | stop tracing after this duration |
Max Size | stop tracing after this many bytes |
At least one of Max Time or Max Size is required.
Fill in the matching criteria and click Add. The profile appears in the list:
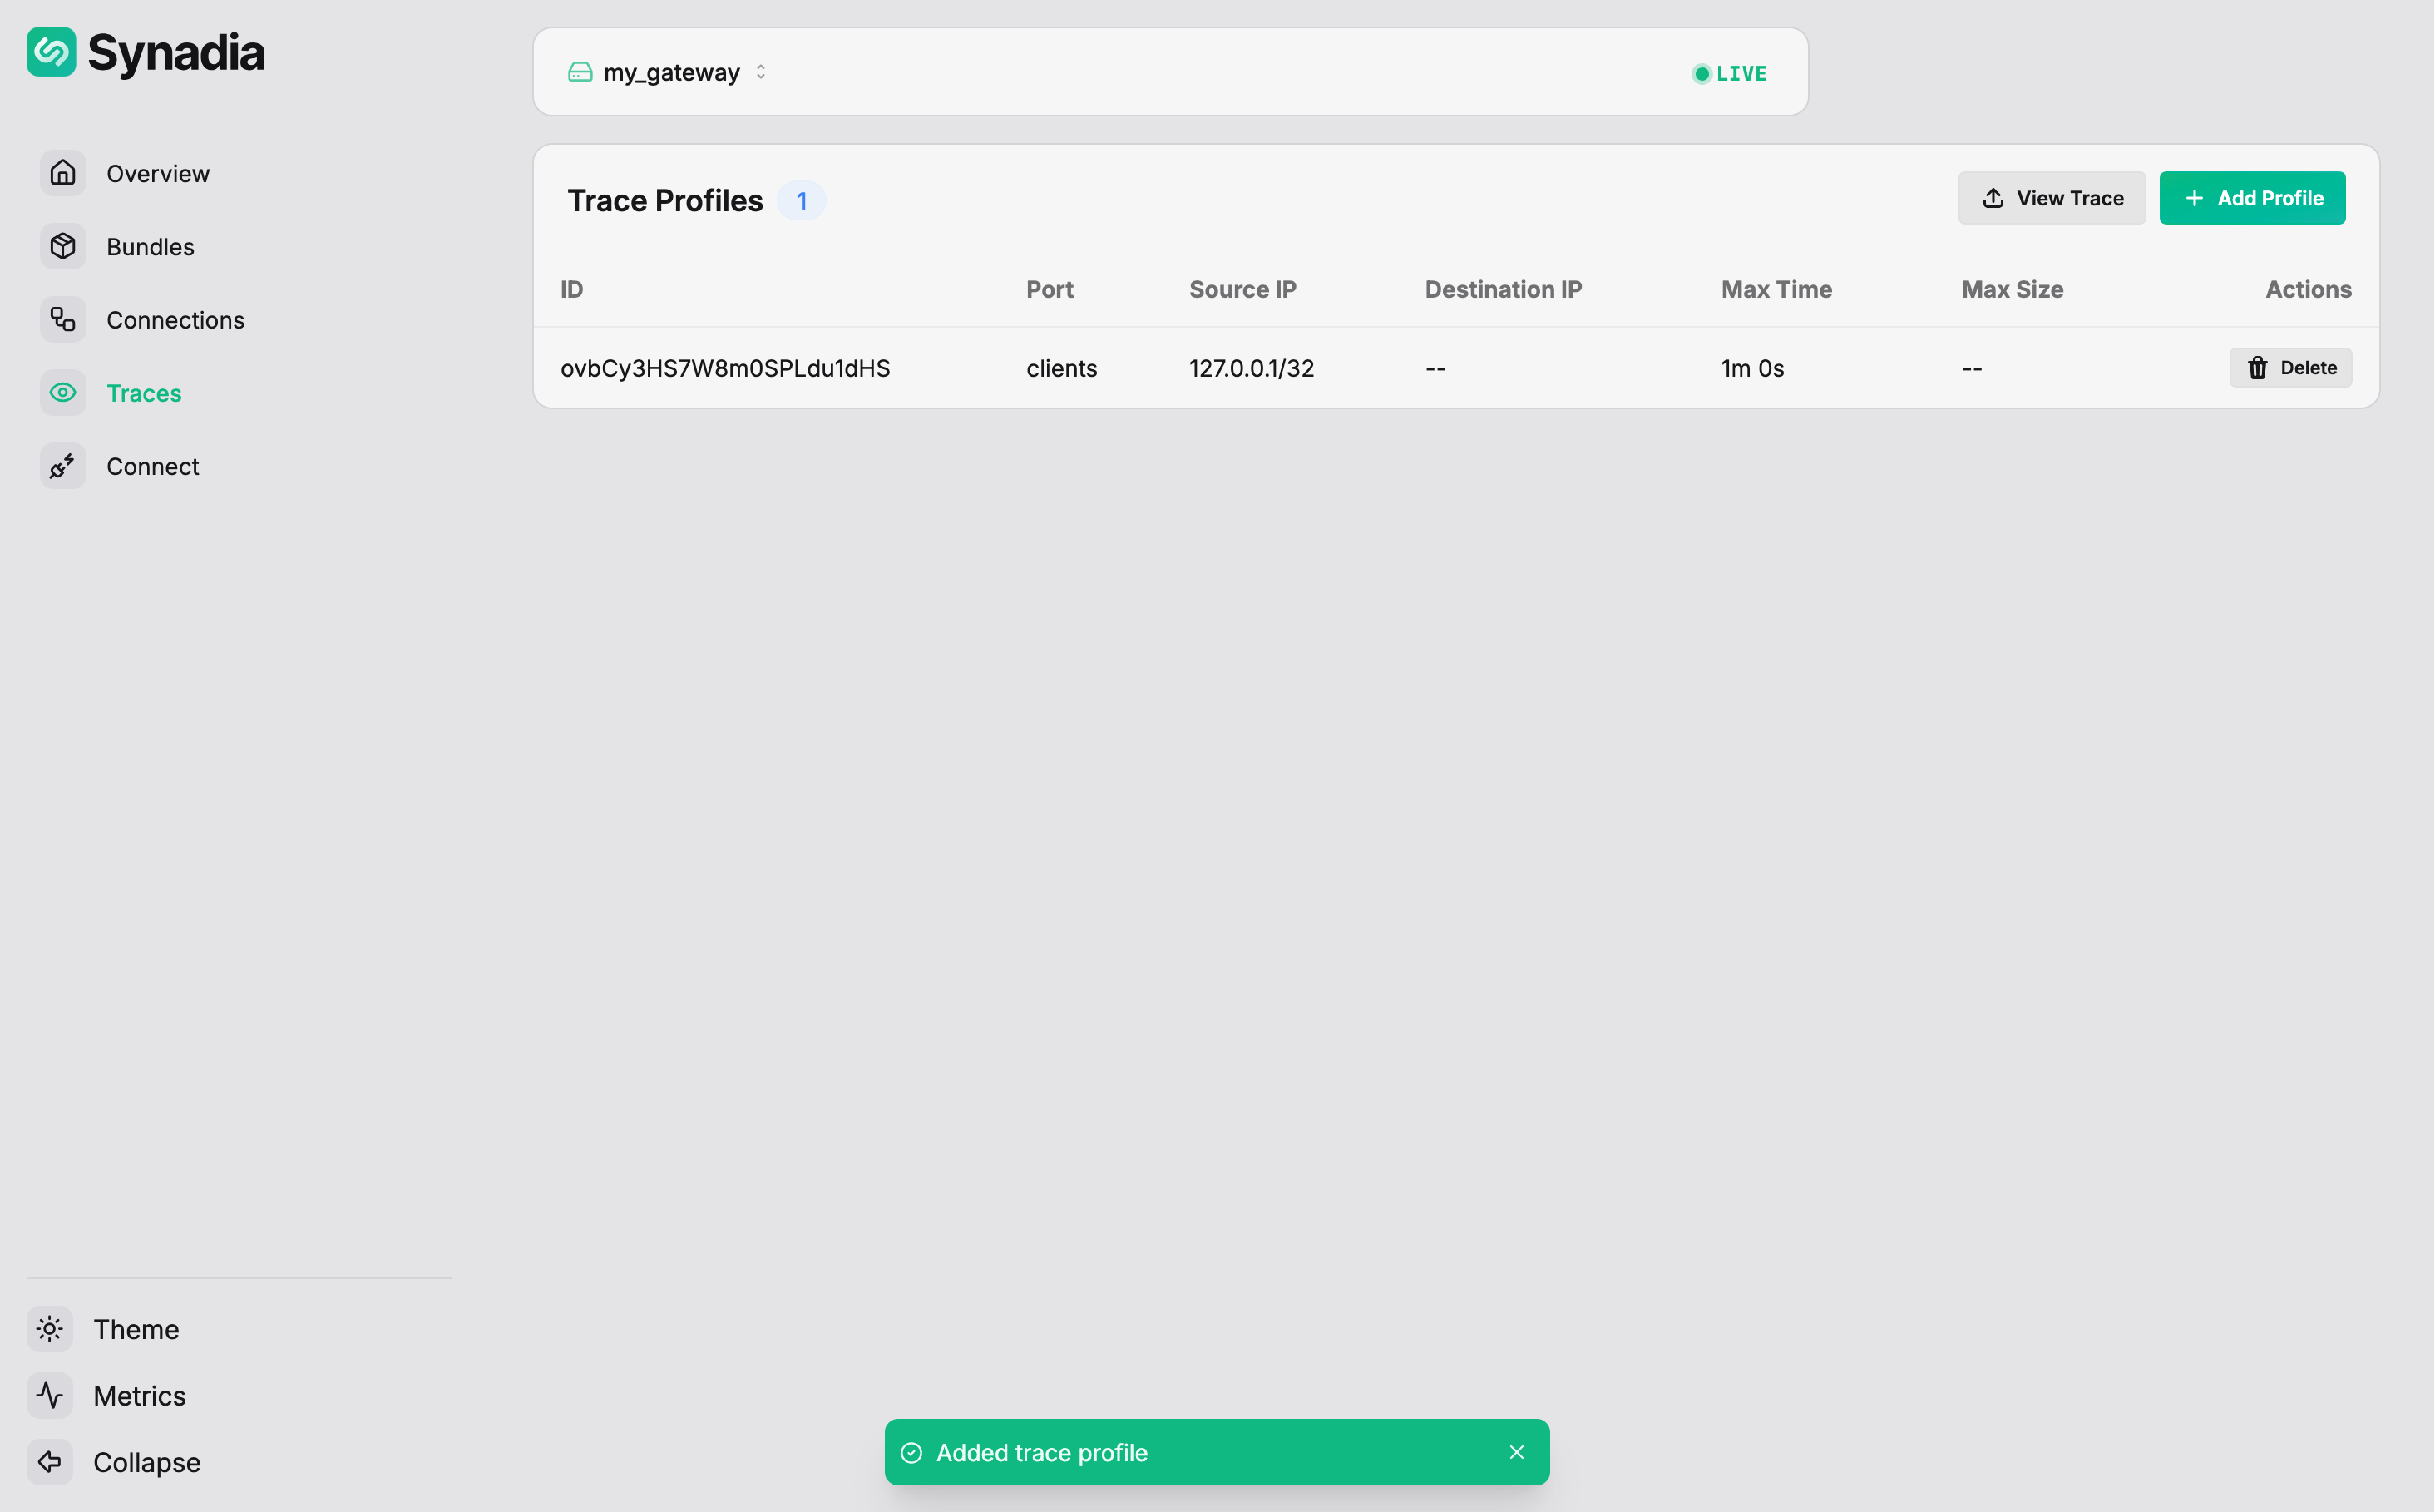
The table shows the profile ID, port, source/destination IPs, limits, and a Delete action.
Deleting a profile
Click Delete on a profile row to remove it. Any active traces for that profile will be stopped.
Viewing trace files
Trace files are written to the client_trace_dir on the gateway's filesystem. To view a trace in the UI, click View Trace and select a trace log file from disk:
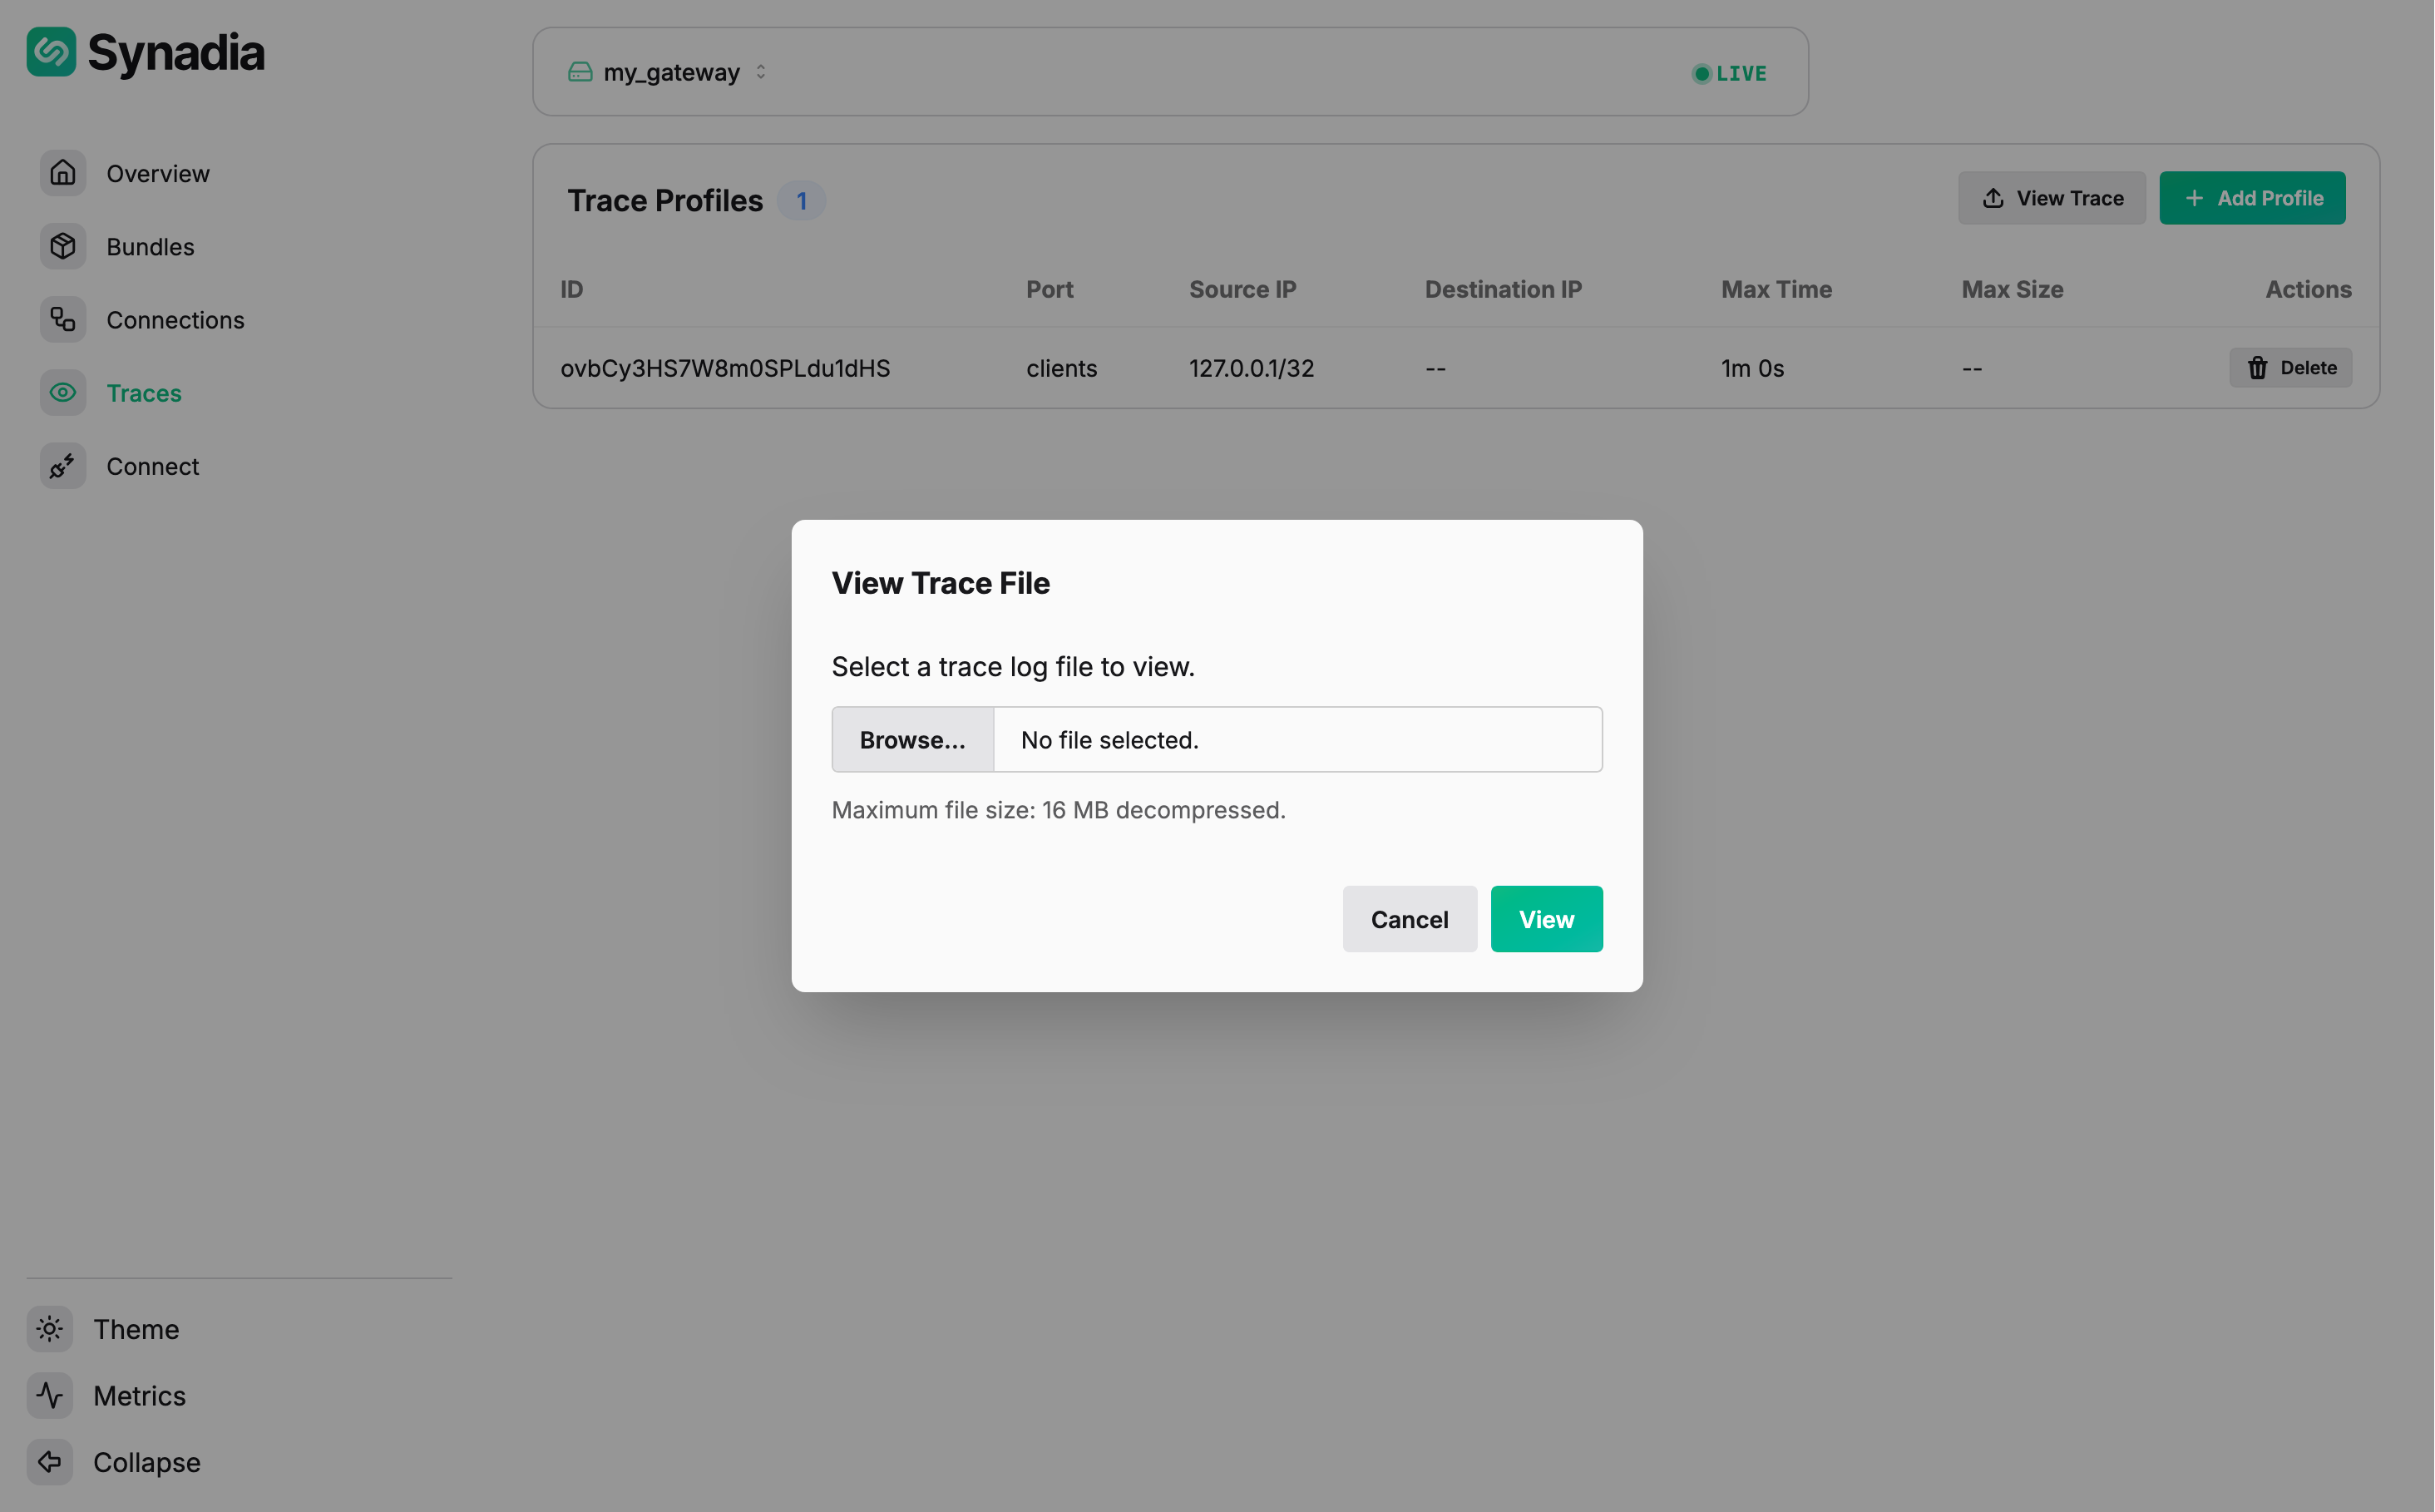
The user must have access to the gateway's trace directory to upload files to the viewer.
The Trace Viewer shows the decoded protocol exchange. Here is a trace of an allowed publish:
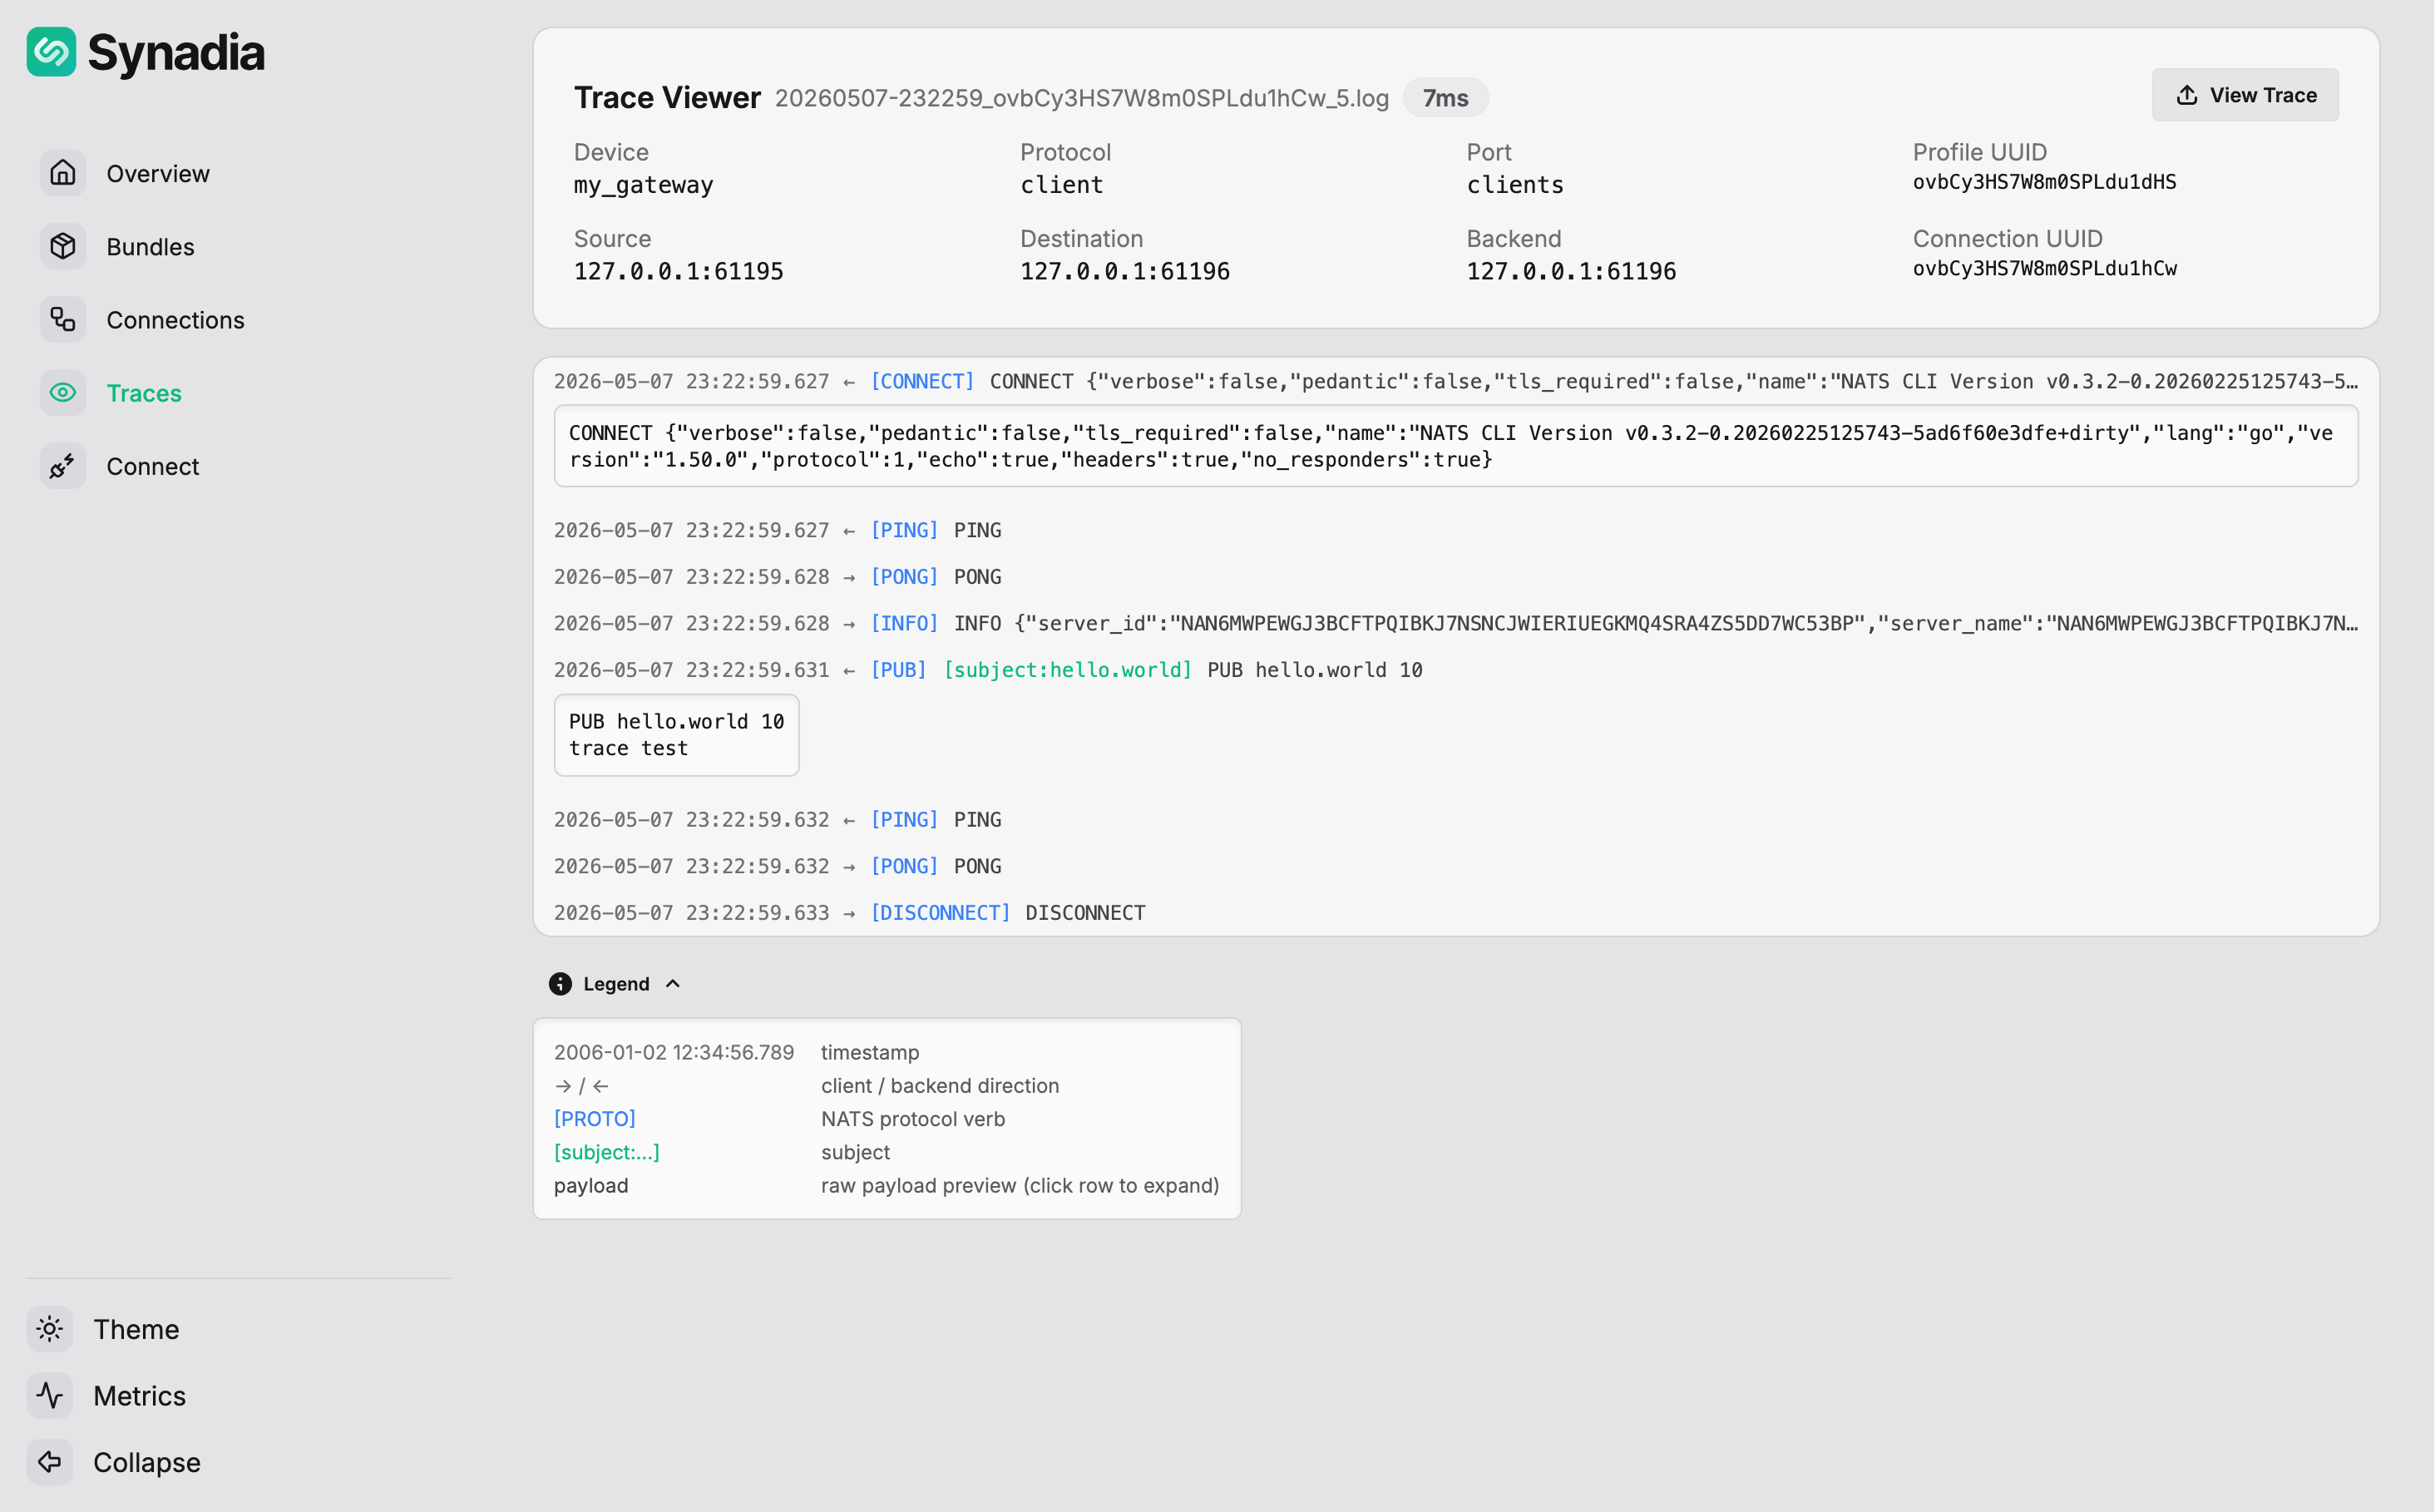
The PUB hello.world 10 / trace test message was allowed, followed by a clean DISCONNECT.
Here is a trace of a denied publish:
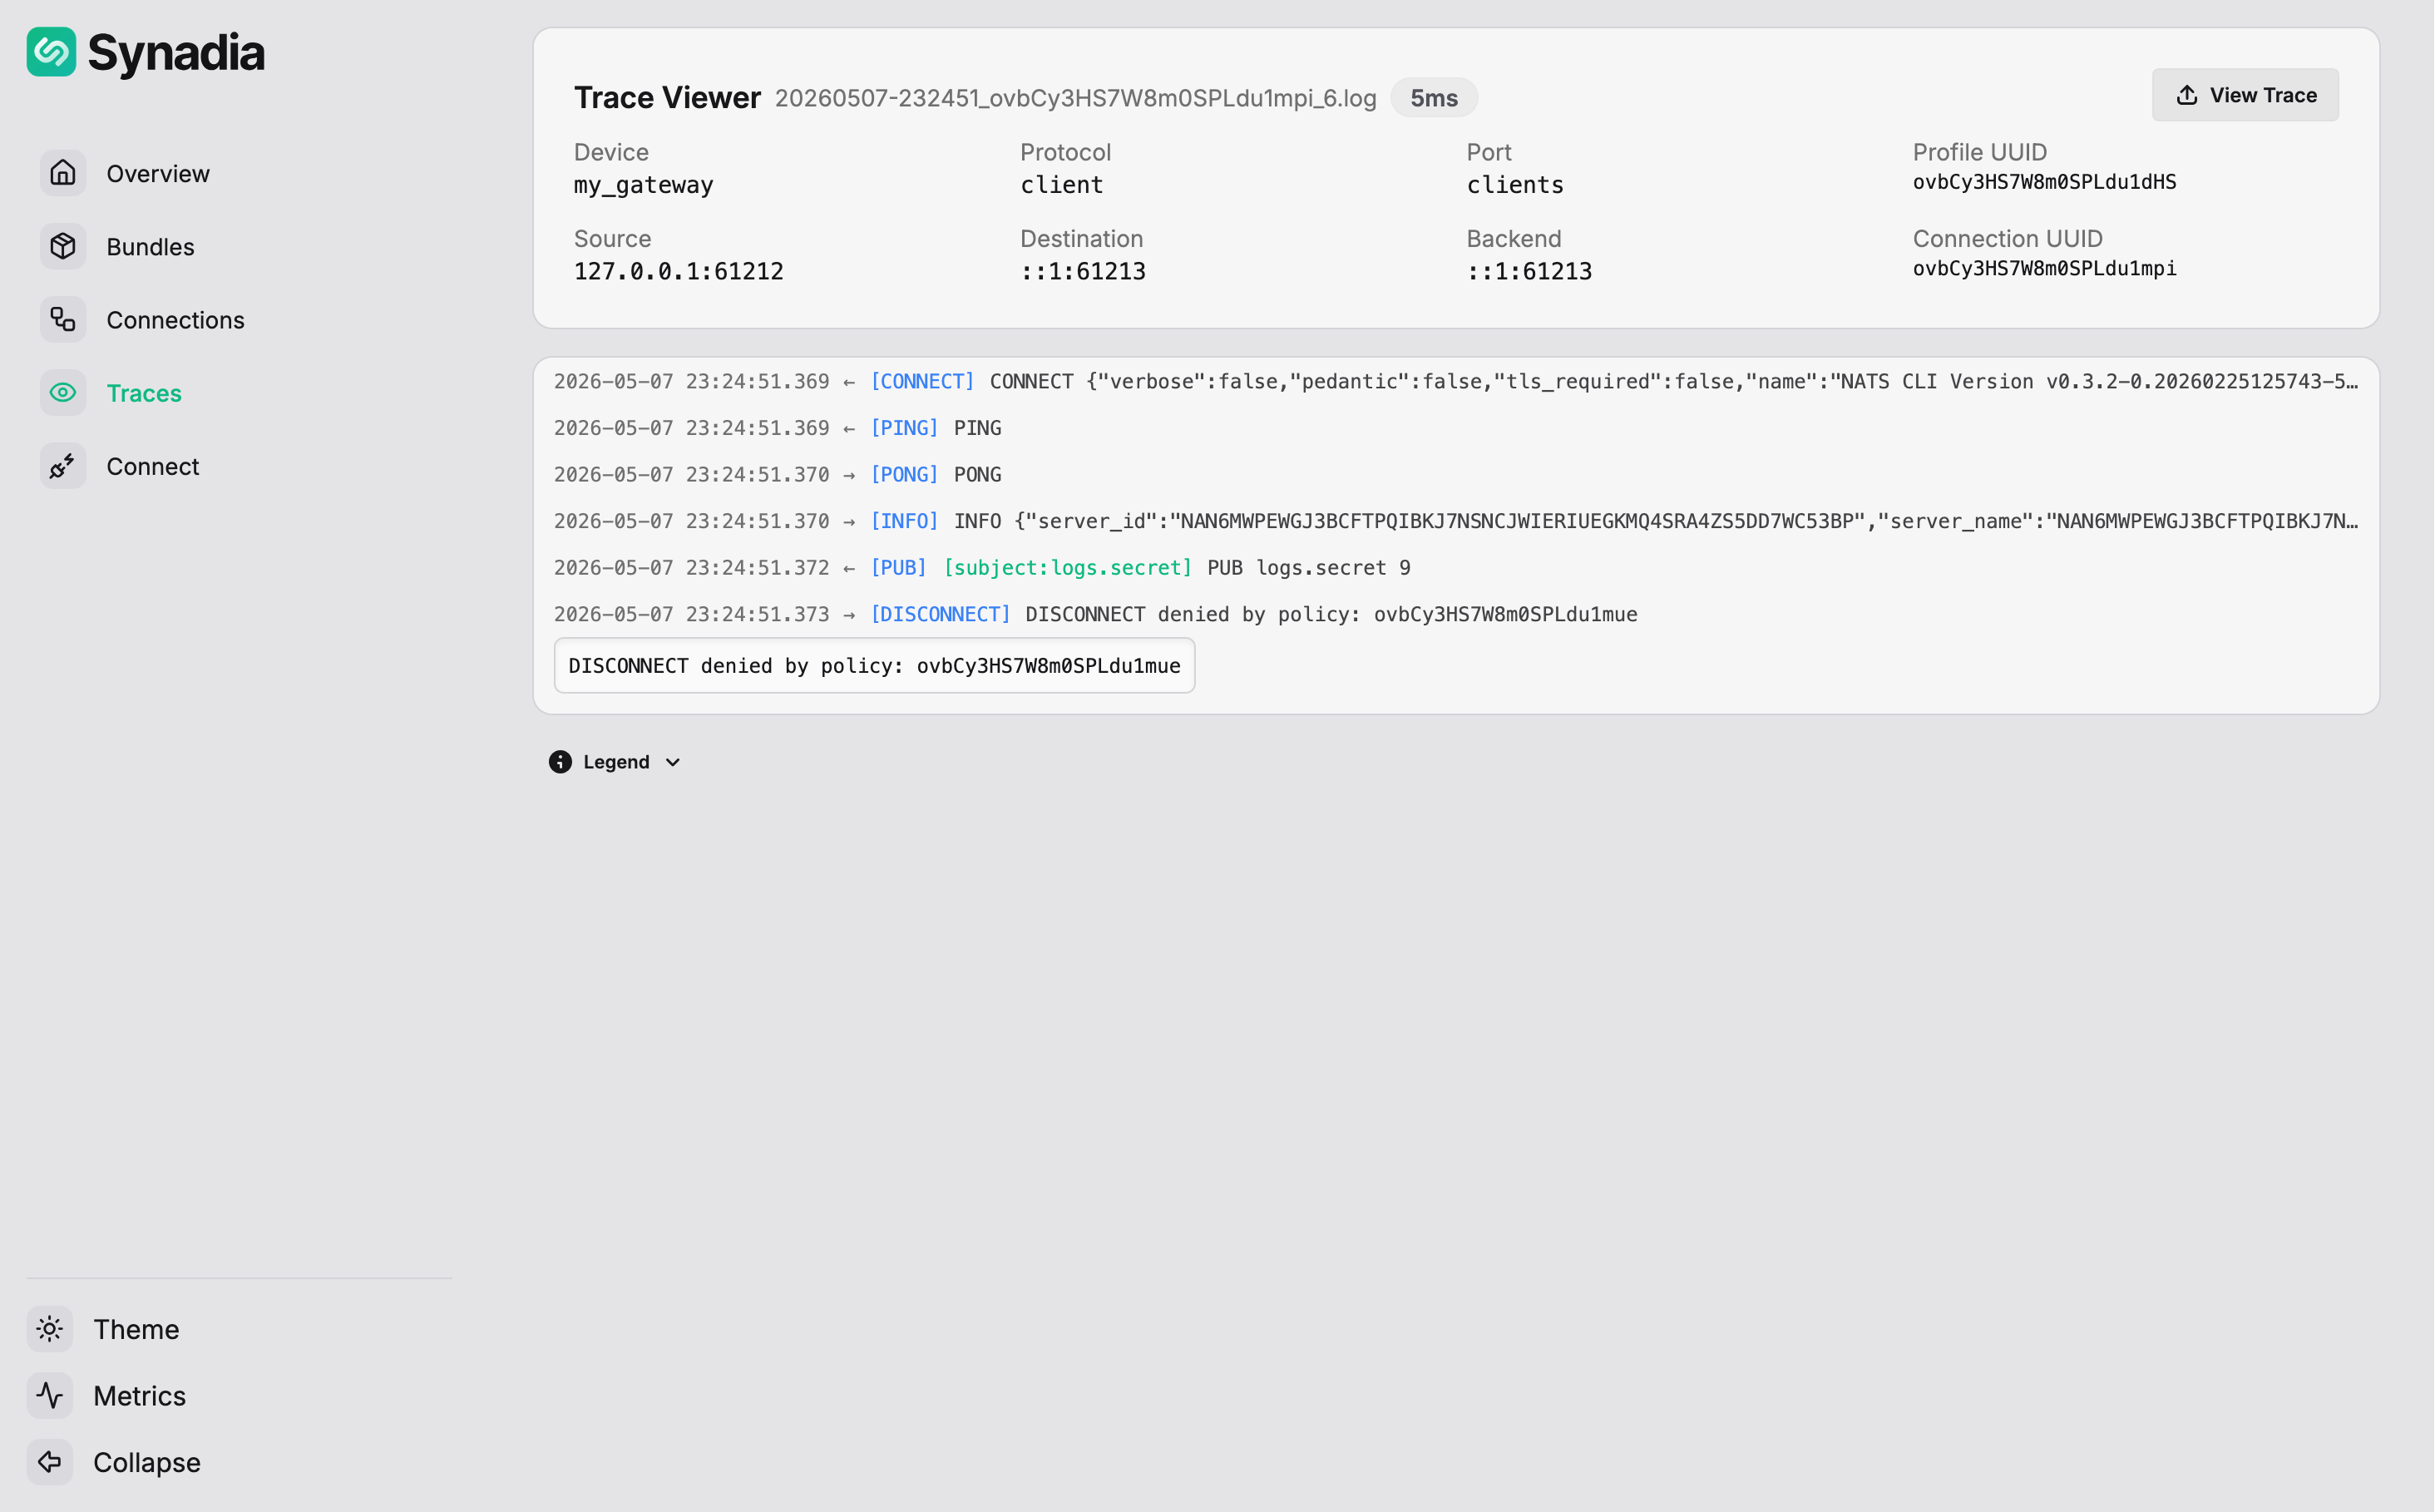
The PUB logs.secret 9 / api_key=1 message matched the deny payload rule. The DISCONNECT shows denied by policy with the event ID that correlates to the audit log.
Trace Viewer layout
The viewer header shows connection metadata:
| Field | Description |
|---|---|
| Device | gateway name |
| Protocol | client or leaf |
| Port | gateway port name |
| Profile UUID | trace profile that triggered the capture |
| Source | client IP and port |
| Destination | backend IP and port |
| Backend | backend server address |
| Connection UUID | unique connection identifier |
Below the header, a summary shows the total number of protocol entries and the trace duration.
Reading protocol messages
Each row shows one NATS protocol operation:
←arrow — client-to-backend traffic→arrow — backend-to-client traffic- Timestamp and protocol type (
CONNECT,INFO,PUB,SUB,MSG,PING,PONG, etc.)
Click the ∨ chevron on any row to expand and see the decoded protocol data. For example:
- A
CONNECTrow expands to show the full CONNECT JSON with client name, language, version, and protocol options - A
SUBrow shows the subscription subject and SID - A
MSGrow shows the subject, size, and decoded payload (e.g.,MSG foo.bar 1 25 {"message":"Hello World"}) PING/PONGrows show the raw keepalive protocol
The viewer decodes the base64-encoded data from the trace file into readable NATS protocol, making it easy to inspect exactly what a client sent and received.